
IR drop is the voltage lost in the power grid between the supply and the cells. Static IR drop uses the average current of every cell; dynamic IR drop looks at the current peaks when many cells switch at once. This article explains both, shows how OpenROAD reports static IR drop, and measures how the strap pitch and width of the grid change the drop in the 16x16 multiplier.
8 min read | Intermediate
What You'll Learn
- Tell static and dynamic IR drop apart
- Read the IR drop report of OpenROAD's power analysis
- Measure how strap pitch and width change the drop
- Know the usual IR drop targets and the fixes when a design misses them
Static IR Drop
Static analysis takes the average current of every cell, computed from its power at the expected switching activity, and solves the grid as a network of resistors. The result is a DC voltage at every node of the grid. It answers the question: on average, how much lower is the supply at each cell?
OpenROAD's power analysis, analyze_power_grid, does exactly this. It needs the cell powers (from the same data as report_power), the resistance of every wire and via in the grid, the supply voltage and the points where current enters. Without a file that gives those points, it assumes a flip-chip bump pattern over the core:
[INFO PSM-0040] All shapes on net VDD are connected.
[INFO PSM-0073] Using bump pattern with x-pitch 140.0000um, y-pitch 140.0000um, and size 70.0000um with an reduction factor of 3x.
The Report
For the multiplier with straps every 27 um, the inputs toggling in 50 % of the cycles and a 10 ns clock:
Total power      : 1.58e-02 W
Worstcase voltage: 1.80e+00 V
Average voltage  : 1.80e+00 V
Average IR drop  : 5.15e-04 V
Worstcase IR drop: 1.31e-03 V
The voltages are rounded to three digits, so read the drops: on average the cells lose 0.52 mV, and the worst cell 1.31 mV, 0.07 % of 1.8 V. The VSS net has its own report: there the "drop" is a rise of the ground, 0.95 mV at worst. A cell sees both, so its effective supply is reduced by the sum.
The -voltage_file option writes the voltage of every node to a CSV file, which is how the maps below were drawn.
Pitch and Width
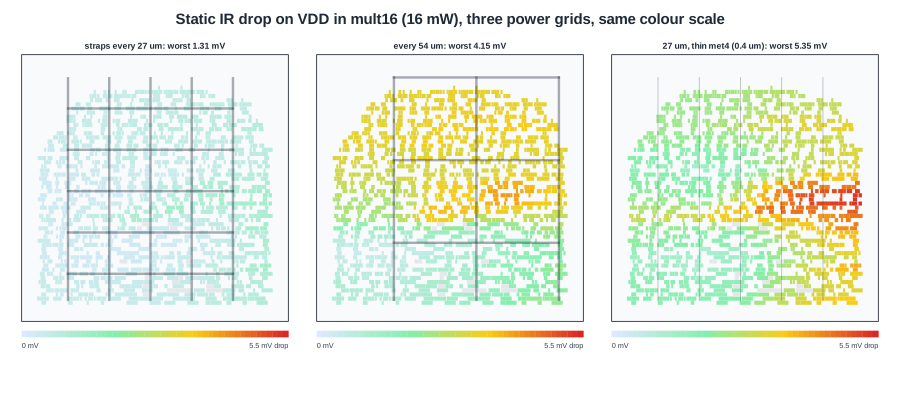
Five grids, the same design and the same activity:
| Grid | Average drop | Worst drop |
|---|---|---|
| met4/met5 straps every 27 um, 1.6 um wide | 0.52 mV | 1.31 mV |
| same, with a core ring | 0.52 mV | 1.33 mV |
| straps every 54 um | 2.48 mV | 4.15 mV |
| straps every 77.5 um (2 per net) | 2.52 mV | 4.53 mV |
| every 27 um, met4 straps 0.4 um wide | 2.52 mV | 5.35 mV |
Doubling the pitch more than triples the worst drop. With fewer straps, every rail is fed less often and the current must flow further along the thin met1. The maps show the pattern: with straps every 27 um the drop is spread evenly, with fewer straps the cells between two straps form hot bands.
The thin met4 straps give the worst result of all. A 0.4 um strap has four times the resistance of a 1.6 um one, and the via stacks under it are smaller too, so the drop is higher even though the straps are close together.
Quick Check
Q: The total power is the same in all five runs. Why does the drop change at all?
Show Answer
The current the cells draw is the same, but the resistance of the path from the bumps to each cell is not. Fewer or thinner straps mean a higher resistance, and the same current through a higher resistance gives a larger drop.
Dynamic IR Drop
The average hides the peaks. Right after a clock edge, the clock tree and the flip-flops switch, and the logic behind them follows within a few hundred picoseconds. The current in that moment can be many times the average. Dynamic IR drop analysis simulates the grid over time, with the resistance, the capacitance of the grid and cells, and the current waveform of every cell from a simulation or from vectorless estimates.
The dynamic drop is usually several times the static drop, and it is what limits large, fast designs. Two things reduce it: a stronger grid, and decoupling capacitance close to the switching cells, which supplies the peak current locally. The power analysis in the lab's OpenROAD flow is static only.
Targets and Fixes
A common target is a total drop (VDD drop plus ground bounce) below 5 % of the supply for dynamic and around 2-3 % for static, but each project and process sets its own. Timing sign-off then uses a library corner at the reduced voltage, or derates the delays.
When a design misses the target, the fixes are, roughly in order of cost:
- Reduce the strap pitch or widen the straps where the drop is high.
- Add decap cells near the hot spots, for dynamic drop.
- Spread out high-power cells that clump together.
- Add more power bumps or pads, which changes the package.
Quick Check
Q: A design passes static IR drop with a large margin but fails timing in silicon at the nominal voltage. What IR drop effect might the static analysis have missed?
Show Answer
Dynamic drop: the momentary drop right after a clock edge, when many cells switch together. Static analysis only sees the average current, which can be far below the peak.
Running It in ChipVerify Lab
Run Place and Route on the multiplier and find the IR drop section of the report. If it is empty and the log shows PSM-0069, the grid has rails only; see Building a PDN in OpenROAD. With a full grid, note the average and worst drop on VDD and VSS. With PRO, change the met4 pitch in a custom script and compare.
Common Mistakes
Mistake #1: Checking only VDD
Ground bounce on VSS reduces the supply a cell sees just as much as a drop on VDD. Add both.
Mistake #2: Running power analysis at default activity
With the default activity the multiplier used 3.7 mW; with the inputs toggling half the time, 16 mW. The drop scales with the current, so analyze at a realistic, worst-case activity.
Mistake #3: Fixing dynamic drop with straps alone
Straps lower the resistance, but the peak current also needs charge stored close to the cells. Decap cells are the usual remedy.
Practice Exercise
Challenge: Scale the Drop
The multiplier's worst static drop at 16 mW is 1.31 mV on the 27 um grid. Estimate the worst drop if the activity doubled the power to 32 mW, and if the same design were run at 1.6 V with the same current.
Hint
The grid is a network of resistors: the drop is proportional to the current.
Solution
Doubling the power at the same voltage doubles the current, so the drop is about 2.6 mV. At 1.6 V with the same current the drop stays 1.31 mV, but as a fraction of the supply it rises from 0.073 % to 0.082 %. In practice the current would also fall at 1.6 V, since switching power scales with the square of the voltage.
Open the ready-made example in the lab, synthesize it and run Place and Route.
Summary
- Static IR drop uses average currents; dynamic IR drop follows the current peaks after clock edges.
analyze_power_gridreports average and worst drop per net;-voltage_filewrites every node.- In the multiplier, straps every 27 um gave 1.31 mV worst drop; every 54 um 4.15 mV; thin 0.4 um met4 straps 5.35 mV.
- Add VDD drop and VSS bounce, and analyze at worst-case activity.
- Fixes: tighter or wider straps, decaps, spreading hot cells, more bumps.
