
Global routing decides, for every net, which part of the chip its wires will pass through and on which layers, before any exact wire is drawn. It is also where congestion first becomes a hard number: each region of the chip has a fixed number of tracks, and the global router counts how many of them the nets need. This article explains the GCell grid, how capacity and demand are counted, how to read OpenROAD's congestion report, and what happens to it when the 16x16 multiplier is packed into smaller and smaller dies.
7 min read | Intermediate
What You'll Learn
- Explain GCells, edge capacity and demand
- Read the global router's congestion report
- Describe what overflow means and how the router removes it
- Compare congestion of the same design at different utilizations
The GCell Grid
The global router covers the die with a grid of square GCells (global routing cells). In the lab's flow on sky130 each GCell is 6.9 x 6.9 um, about 2.5 standard-cell rows tall, so a 175 um die is covered by 25 x 25 GCells and a 127 um die by 18 x 18.
Inside a GCell the router does not care where a wire runs. It only tracks which GCells a net passes through and which edges between neighbouring GCells it crosses. Each edge has a capacity per layer: the number of tracks of that layer crossing it, minus any blocked by power straps, macros or routing blockages. From the track pitches in Routing Basics, a 6.9 um GCell edge has about 20 met1 tracks and 15 met2 tracks.
The router then finds a path for every net through the grid, a set of connected GCells on chosen layers, and adds one unit of demand on each edge it crosses. A good global route keeps demand at or below capacity on every edge.
Reading the Congestion Report
After routing, OpenROAD's global_route prints a summary per layer. This one is from the multiplier at 44 % core utilization:
[INFO GRT-0096] Final congestion report:
Layer         Resource        Demand        Usage (%)    Max H / Max V / Total Overflow
---------------------------------------------------------------------------------------
li1                  0             0            0.00%             0 /  0 /  0
met1              9313          1809           19.42%             0 /  0 /  0
met2              8132          2084           25.63%             0 /  0 /  0
met3              5867            36            0.61%             0 /  0 /  0
met4              4078            16            0.39%             0 /  0 /  0
met5              1013             0            0.00%             0 /  0 /  0
---------------------------------------------------------------------------------------
Total            28403          3945           13.89%             0 /  0 /  0
- Resource is the total edge capacity of the layer over the whole grid, the same number as in the routing resources table at the start of global routing.
- Demand is the total capacity the routed nets use.
- Usage is demand divided by resource.
- Overflow counts edges where demand exceeds capacity: the worst horizontal edge, the worst vertical edge, and the total. All zero means every net found a path without exceeding any edge.
Usage is an average over the whole layer. A layer at 25 % can still have edges that are full, so the overflow columns, not the usage, tell you whether the global route is legal.
Quick Check
Q: met2 usage is 25.63 % with zero overflow. Does that mean every met2 edge is about a quarter full?
Show Answer
No. Usage is the total demand divided by the total capacity of the layer. Wires gather where the cells and pins are, so some edges in the middle of the core are much fuller than the average and edges near the core boundary are almost empty. Zero overflow says only that no edge is over its capacity.
Packing the Same Design Tighter
To see how congestion grows, the multiplier was placed and routed in four die sizes, keeping the netlist and the 10 ns clock the same. These runs used no capacity reserve in global routing, described below, and a placement target density of 0.95. The smaller the die, the higher the core utilization:
| Die | Core utilization | met1 usage | met2 usage | met3 usage | met4 usage | Overflow | Final WNS |
|---|---|---|---|---|---|---|---|
| 175 um | 44 % | 19.4 % | 25.6 % | 0.6 % | 0.4 % | 0 | +0.58 ns |
| 137 um | 75 % | 33.7 % | 38.6 % | 7.9 % | 4.2 % | 0 | +0.37 ns |
| 130 um | 84 % | 36.1 % | 45.8 % | 7.0 % | 12.9 % | 0 | +0.19 ns |
| 127 um | 89 % | 34.3 % | 45.7 % | 4.5 % | 3.8 % | 0 | +0.47 ns |
Three effects show up:
- Usage rises with utilization. The wire length hardly changes, about 28 to 30 mm in every run, but the resources shrink with the core area. At 127 um the router had 4,646 met1 and 4,180 met2 units, half of what it had at 175 um.
- The router spills to upper layers. At 44 %, met3 and met4 carry almost nothing. At 75 % and above, the router sends more nets up to met3 and met4 to relieve met1 and met2, even though that costs vias.
- Even 89 % passed global routing. The multiplier has short, local nets and no macros. At 89 % the router needed two extra iterations to clear overflow, which the log reports:
[INFO GRT-0101] Running extra iterations to remove overflow.
[INFO GRT-0102] Start extra iteration 1/50
[INFO GRT-0102] Start extra iteration 2/50
The extra iterations are rip-up and reroute: the router removes the nets crossing overflowed edges and routes them again with a higher cost on the full edges, so they detour through emptier GCells or move to another layer. Two iterations were enough here; it gives up after 50.
The worst slack does not follow utilization neatly, because each run also has a different placement and its own repair results. The 84 % run happened to end with the slowest critical path.
Capacity Reserve: How Much of Each Track Count to Trust
The global router does not see pin access inside the cells or the spacing rules between wires, so flows usually let it use only part of each layer's tracks. The setting is a layer adjustment. It shows in the routing resources table of the log (GRT-0053) as the derated resources and the reduction in percent; GRT-0022 Global adjustment reports only an adjustment set for all layers at once and stays at 0 % when the reserve is set for a range of layers, as here:
set_global_routing_layer_adjustment met1-met5 0.5
With 0.5, the router's model keeps half of every edge's tracks in reserve for the detailed router. OpenROAD-flow-scripts and the lab's flow use 0.5 for sky130; the runs above used 0, which is why they could fill the tracks so far. The same four dies were routed again with the 0.5 reserve, the per-layer wire RC values that OpenROAD-flow-scripts uses for sky130, and a placement density just above the minimum the placer can reach:
| Die | Core utilization | met1 / met2 usage of the reduced capacity | met3 / met4 usage | Result |
|---|---|---|---|---|
| 175 um | 44 % | 35.6 % / 48.0 % | 10.9 % / 15.0 % | routed, 3 extra iterations |
| 137 um | 75 % | 51.3 % / 61.6 % | 43.4 % / 32.0 % | routed, 6 extra iterations |
| 130 um | 84 % | 67.8 % / 81.1 % | 60.3 % / 61.7 % | stopped, 77 edges overflow |
| 127 um | 89 % | 73.8 % / 88.8 % | 68.9 % / 76.2 % | stopped, 135 edges overflow |
With the reserve, the router uses the upper layers much earlier, and at 84 % and above it gives up after its 148 rip-up iterations with GRT-0116 Global routing finished with congestion. Most of the remaining overflow sits on met2 and met4, where the power grid's met4 straps also take tracks.
Neither verdict is the truth on its own. Without a reserve, the router accepts placements that the detailed router may then struggle with for a long time; with a large reserve it can reject placements that would route. The 84 % and 89 % dies above did route clean without the reserve. The reserve is a calibration of the global router against the detailed router, and its value should be checked on real designs in each technology. Debugging Congestion shows both failure modes on one design.
Where the Wires Are
The averages hide the local picture. The map below divides the routed wires of two of the runs over the GCell grid, and colours each GCell by the share of its met1 or met2 track length that is used, whichever is higher:
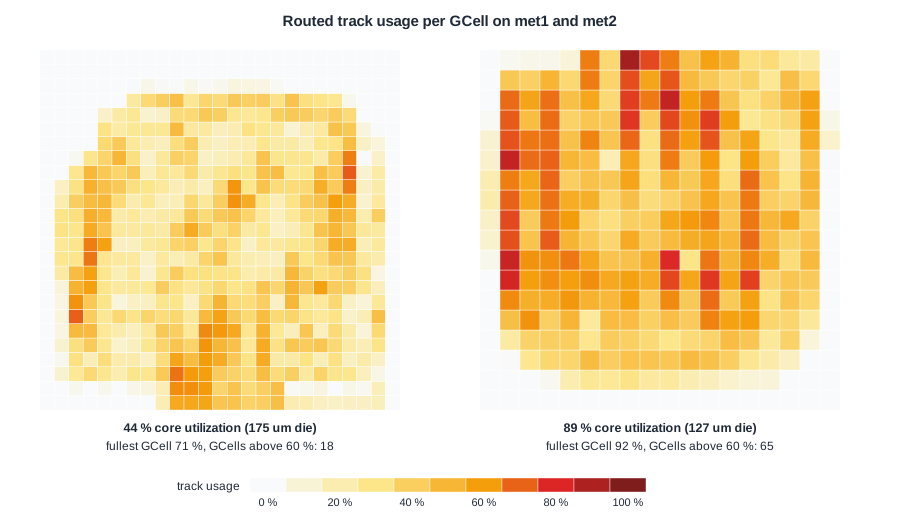
At 44 % the cells sit in the middle of a large core, and the fullest GCell is at 71 %. At 89 % the whole core is filled, and 65 GCells are above 60 %, the fullest at 92 %. Hot spots form where many cells with many pins sit together. These are the regions where a little more logic, or a power strap or macro edge, would cause real overflow.
This map is computed from the final routed wires, not from the global router itself. When there is overflow, global_route -congestion_report_file writes a report of the overflowing GCells, which the OpenROAD GUI can show as a heat map.
Quick Check
Q: At 89 % utilization, met1 usage (34.3 %) is lower than at 84 % (36.1 %). Why can usage fall when the core gets smaller?
Show Answer
Usage depends on where the router puts each net, not only on area. In the 84 % run the placement and routing created more detours and more wires on met1, while the 89 % run found shorter routes, with 27.9 mm of wire against 30.4 mm. Different placements of the same netlist give different demand, so small differences between runs are noise, and the trend over many runs is what matters.
Running It in ChipVerify Lab
Run Place and Route on the multiplier and open the congestion map of the report, which shows the usage of every GCell per layer. In the log, find the routing resources table and the final congestion report (GRT-0096). With the flow's 0.5 reserve, the multiplier at 40 % reported 36.1 % usage on met1 and 46.5 % on met2, close to the 44 % row of the second table above, and needed three extra iterations.
The lab's flow uses the 0.5 reserve, and when global routing fails with it, retries once with 0.3 and says so in the log. The panel accepts utilizations up to 75 %, which the multiplier routes in 3 to 5 minutes. With PRO, a die area of 0 0 129.93 129.93 gives the 84 % core of the tables: there the flow's global route failed at 0.5 (GRT-0116), passed on the retry at 0.3, and detailed routing did not finish within the 30 minutes a PRO job may run. The PRO options also set the reserve directly and limit the detailed routing passes.
Common Mistakes
Mistake #1: Reading usage as a measure of local congestion
A 25 % average can hide full edges. Check the overflow columns and look at a map before deciding that a layer has room.
Mistake #2: Ignoring GRT-0101
Extra iterations mean the first solution had overflow. A design that needs many of them is close to the limit, and detailed routing will have a harder time there.
Mistake #3: Fixing congestion with utilization alone
Utilization is an average over the core. Congestion usually comes from a few regions with dense, high-pin-count logic, which a slightly larger die does not always fix. Debugging Congestion covers the targeted fixes.
Practice Exercise
Challenge: Headroom on met2
In the 127 um die, met2 has 4,180 units of resource and a demand of 1,912. Suppose a design change added nets needing another 2,100 units of met2, spread like the existing ones. What would the met2 usage be, and would you expect the global route to be free of overflow?
Hint
Compute the new average, then think about the hot spots in the map.
Solution
(1,912 + 2,100) / 4,180 = 96 % average usage. Overflow is almost certain: if the new demand follows the existing pattern, the GCells that are already above 90 % would need roughly twice their present demand, far over their capacity, while the edges near the die boundary stay nearly empty. Average usage well below 100 % is necessary for a clean route, not sufficient.
Open the ready-made example in the lab, synthesize it and run Place and Route.
Summary
- Global routing divides the core into GCells and routes each net through the grid, counting demand on every edge against its track capacity.
- The congestion report gives resource, demand and usage per layer; the overflow columns say whether any edge is over capacity.
- Overflow is removed by rip-up and reroute iterations, reported as GRT-0101.
- Packing the multiplier from 44 % to 89 % utilization halved the resources, pushed nets to met3 and met4, and raised the fullest GCell from 71 % to 92 %.
- The capacity reserve (layer adjustment) decides how strict the global router is: with 0.5, the 84 % and 89 % dies were rejected; with none, they passed.
- Averages hide hot spots; a map of the core shows where congestion builds.
