
The delay of a cell is not one number. The same AND gate is faster with a light load and slower with a heavy one, and faster when its input switches sharply than when the input is slow. Libraries capture this with lookup tables called NLDM, the Non-Linear Delay Model. This article shows how to read one and how the tool turns it into the delay you see in a report.
Think of filling a bucket from a tap. A bigger bucket takes longer to fill, and a tap that is turned on slowly delays everything further. A gate behaves in the same way: the bucket is the load on its output, and the speed at which the tap opens is the sharpness of its input edge. The table simply lists the answer for many combinations of the two.
8 min read | Intermediate
What You'll Learn
- Explain what the delay and output slew of a cell depend on
- Read an NLDM table: its two axes and its entries
- Calculate a delay by interpolating between table entries
- Describe how a cell changes the slew of the signal passing through it
Two Things That Set the Delay
A cell has to charge or discharge whatever its output is connected to, which is called the load. The delay depends on two factors:
- The output load: the capacitance on the output pin. A bigger capacitance takes longer to charge.
- The input slew: how long the input signal takes to change from low to high or from high to low. A slow input makes the cell switch later.
The output slew depends mainly on the load. A heavy load gives a slow output edge, and a slow input edge usually (not always) gives a larger delay. The slew of one cell's output is the input slew of the next cell, so slew travels along the path together with the delay.
The simplest model would be a formula, such as delay = D0 + D1 x slew + D2 x load. For modern cells a straight line is not accurate enough, so libraries store tables instead.
Reading an NLDM Table
Every arc has four tables: cell_rise and cell_fall for the delay of a rising and a falling output, and rise_transition and fall_transition for the output slew. Each table is a grid:
- The rows are indexed by the input slew (
input_net_transition, index_1, in ns). - The columns are indexed by the output load (
total_output_net_capacitance, index_2, in pF). - Each entry is the delay, or the output slew, in ns.
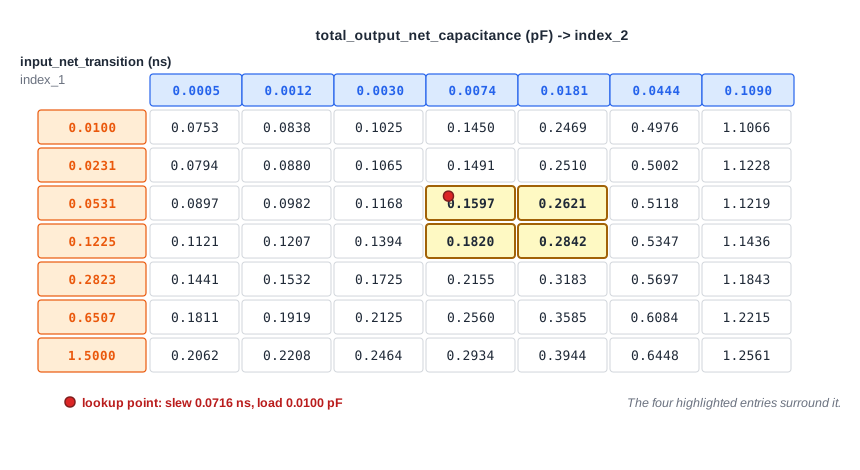
This is the cell_rise table of the arc from A to X of the and2_0 cell. Read it from left to right: with the sharpest input (0.0100 ns), the delay grows from 0.0753 ns at the lightest load to 1.1066 ns at the heaviest. Read it from top to bottom: at a fixed load, a slower input gives a larger delay.
Interpolation
A table only has values at its grid points. A real path hardly ever lands exactly on one, so the tool interpolates between the four nearest entries.
The path from the flip-flop _7_ through the AND gate to the output y has a rising input slew of 0.0716 ns at the AND gate. After set_load 0.01 on y, the load is 0.0100 pF. Both values fall between grid points, and the four highlighted entries surround them. The tool interpolates along the load first, then along the slew:
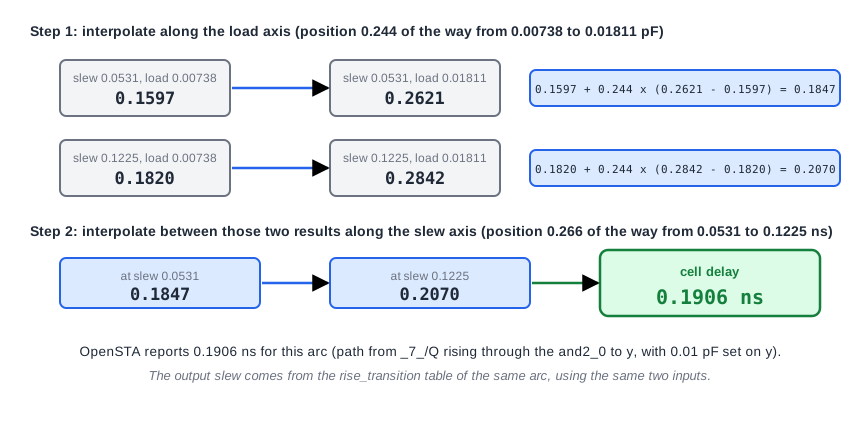
The hand calculation gives 0.1906 ns, and the timing report shows the same value:
             0.0716    0.0000    0.3058 ^ _3_/A (sky130_fd_sc_hd__and2_0)
   0.0100    0.1527    0.1906    0.4965 ^ _3_/X (sky130_fd_sc_hd__and2_0)
The first row shows the input slew 0.0716. The second shows the load 0.0100, the output slew 0.1527 and the delay 0.1906. The slew comes from the rise_transition table by the same interpolation.
A Cell Cleans Up a Slow Edge
The output slew of a cell depends mainly on its load, not on how slow its input was. This is why a cell can restore a poor signal. The AND gate on the path from input b shows it. With a sharp input (slew 0.0 ns) its delay is 0.1201 ns. With a very slow input (slew 0.3 ns) the delay more than doubles to 0.2537 ns, yet the output slew hardly changes:
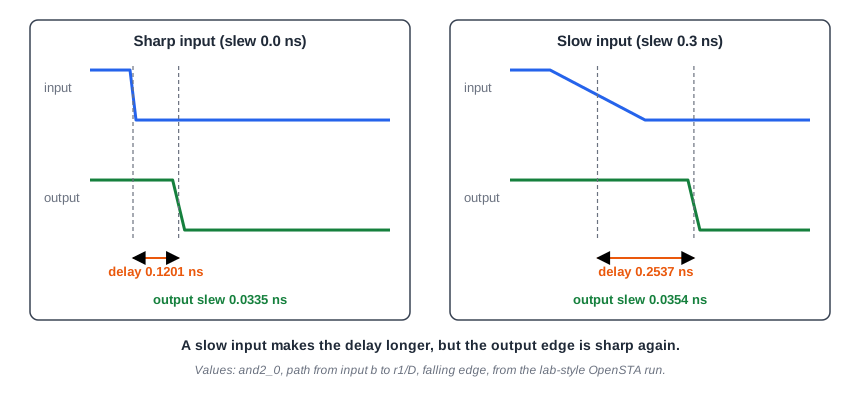
The delay grows with the input slew, but the output edge is sharp again, so only the delay of that one cell is affected, not every cell after it.
How the Numbers Are Measured
The header of the library fixes where on the waveform times and slews are measured. In the sky130 libraries, delay is measured between the 50% points of the input and the output. Slew is the time to go from 20% to 80% of the supply voltage, and the library applies no scaling to it (a derating factor of 1.0). Some other libraries measure slew between 10% and 90%, or between 30% and 70% and scale the result. Slews from libraries with different measurement points cannot be compared directly.
Common Mistakes
Mistake #1: Treating a cell delay as one fixed number
The delay of the same arc is 0.0898 ns with no load on the output and 0.1906 ns with 0.01 pF. Quoting one delay per cell, as in a data sheet, hides how much it depends on the load and the input slew.
Mistake #2: Mixing up the rows and columns of a table
Rows are the input slew and columns are the output load in the delay tables. Swap them and you read the delay of a very different operating point. Always check variable_1 and variable_2 in the table template.
Quick Check: A table has delay 0.10 ns at load 0.001 pF and 0.20 ns at load 0.011 pF (same input slew). What is the delay at 0.006 pF?
0.15 ns. The load is halfway between the two columns, so the delay is halfway between the two entries.
Practice Exercise
Challenge: Predict the Delay, Then Check It
Run the sta_demo design with a 2.0 ns period. Look at the path from _7_/CLK to y. Find the delay of the AND gate (_3_/X) and its input slew (the Slew column of _3_/A). Then add this line to constraints.sdc, and before re-running STA, calculate the new delay by interpolating in the table values above:
set_load 0.01 [get_ports y]
Open the ready-made example in the lab, run synthesis, and then run STA. Editing constraints.sdc and re-running only STA, and choosing another library or corner, are PRO features.
Hint
Use the four highlighted entries of the table: 0.1597, 0.2621, 0.1820 and 0.2842. Interpolate along the load first (the load 0.0100 lies 0.244 of the way between its columns), then along the slew (0.0716 lies 0.266 of the way between its rows).
Solution
Without the load the AND gate delay is 0.0898 ns, and its output slew is 0.0215 ns. With 0.01 pF the interpolation gives 0.1906 ns, which matches the report. The output slew rises to 0.1527 ns, so everything after the AND gate also sees a slower edge. The slack of y falls from 1.2044 to 1.1035 ns, which is the 0.10 ns of extra delay.
Summary
- Cell delay and output slew depend on the input slew and the output load.
- An NLDM arc has four tables:
cell_rise,cell_fall,rise_transitionandfall_transition. - Rows are the input slew and columns are the output load, both with units set by the library header.
- The tool interpolates between the four nearest table entries when a lookup falls between grid points.
- A cell mostly resets the slew: the output slew depends mainly on the load, and much less on how slow the input was.
- Slew measurement points differ between libraries, so check them before comparing.
