
The cells of a chip are supplied through a grid of metal wires. These wires have a resistance, and when a current flows through them, the voltage at the cell is lower than the voltage at the pin of the chip. This difference is the IR drop, the current I times the resistance R. A cell with a lower supply voltage is slower. The library corners assume one fixed voltage for all cells, so the effect of IR drop on timing has to be added. This article explains where the drop comes from, how it changes the delay, and how a flow puts it into STA.
8 min read | Intermediate
What You'll Learn
- Explain what IR drop is and why it differs from cell to cell
- Say why a lower supply voltage makes a cell slower
- Apply a derate to one cell and calculate its effect on the slack
- Describe how a flow gets the per-cell voltage into the timing analysis
Where the Drop Comes From
The supply goes from the pins of the chip through thick top metal layers and a mesh of thinner wires down to each cell. Every segment has a resistance. When many cells switch at the same time, their currents add up in the shared wires, and the voltage along the grid falls. The cells that are far from the supply pins, or in a busy region, see the largest drop. The ground network has the same effect in the other direction, called ground bounce: the local ground rises above zero.
There are two ways to look at it:
- Static IR drop: the average current of the chip, which gives a steady drop.
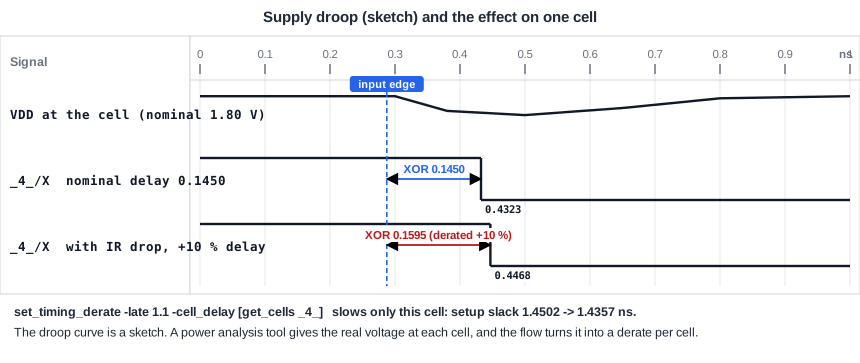
- Dynamic IR drop: the current of a short burst when many cells switch in the same clock cycle. It is larger and lasts for a short time, as in the sketch.
Why It Slows the Cell
A transistor drives a current that depends on how far the supply voltage is above its threshold voltage. If the voltage at the cell falls, the current falls, the load is charged more slowly, and the delay grows. The effect is stronger when the supply is low compared with the threshold, so it gets more important with each technology generation. As an order of magnitude, a drop of a few percent of the supply can add several percent to a cell delay, and the exact number depends on the technology and on the cell.
The library corners already contain a lower voltage: the slow sky130 corner is at 1.60 V instead of 1.80 V. That voltage is a global value for all cells, chosen to cover the supply tolerance. The IR drop is a local effect, which comes on top of it and differs from place to place.
A Derate for One Cell
A simple way to include IR drop is to derate the cells that suffer from it. In OpenSTA, the command set_timing_derate can be limited to a cell. If the XOR gate _4_ of the demo circuit sees 10 percent more delay because of its supply drop, the late derate is:
set_timing_derate -late 1.1 -cell_delay [get_cells _4_]
Only that cell is changed. Its delay on the path grows from 0.1450 ns to 0.1595 ns, the arrival at the data pin of the second flip-flop moves from 0.4323 ns to 0.4468 ns, and the setup slack falls from 1.4502 ns to 1.4357 ns. The flip-flop at the start of the path keeps its clock-to-Q delay of 0.2874 ns. If all cells get the same derate, as in the article about on-chip variation, the arrival is 0.4756 ns and the slack 1.4070 ns. The per-cell derate is more accurate and less pessimistic, because it only slows the cells that really see the drop.
How a Flow Does It
- A power analysis tool calculates the voltage at every cell from the layout, the supply network and the switching activity. The result is a voltage per cell and per time.
- The timing tool converts the voltage into a delay change, either with a table or by calculating the cell delay at the real voltage, with library tables for several voltages.
- The delay of each cell is changed on the paths where it switches, usually for the worst or the average case.
- The timing report shows the paths with the effect included. Violations that result are fixed by changing the power grid, adding decoupling capacitors, moving cells, or changing the logic.
For hold, the cells that see a drop on the capture side can be slower, and those on the launch side get a longer data path. The direction that is worse depends on the path, so the analysis has to be done for both checks.
Dynamic Versus Static
A static number is simple and pessimistic. A dynamic analysis is more accurate, because it takes into account which cells actually switch in the same cycle as the path. It needs vector-based or activity-based power data and takes more effort. Many teams use the static value early and refine the critical paths with the dynamic result.
Common Mistakes
Mistake #1: Assuming the corner voltage already includes IR drop
The corner voltage covers the tolerance of the supply at the chip pin. The drop in the grid is an extra reduction, which differs from cell to cell and is not part of the library.
Mistake #2: Fixing an IR-drop violation only in timing
The cause is in the power grid. Upsizing cells on a path with a drop adds current and can make the drop worse. Look at the grid first.
Quick Check: A cell has a nominal delay of 0.20 ns and its supply falls so that the delay grows by 8 percent. What is its derated delay?
0.20 x 1.08 = 0.216 ns.
Practice Exercise
Challenge: Derate One Cell
Use the sta_demo design with the basic constraints. The setup slack of the path from the first to the second flip-flop is 1.4502 ns. Derate only the XOR gate (_4_ in our run, find its name in your report) by 10 percent and predict the slack before you run it:
set_timing_derate -late 1.1 -cell_delay [get_cells _4_]
Open the ready-made example in the lab, run synthesis, and then run STA. Editing constraints.sdc and re-running only STA, and choosing another library or corner, are PRO features.
Hint
The XOR delay is 0.1450 ns. Only this delay changes.
Solution
The new XOR delay is 0.1450 x 1.1 = 0.1595 ns, which adds 0.0145 ns. The setup slack becomes 1.4502 - 0.0145 = 1.4357 ns, and the report shows 1.4357 ns. The other cells of the path are unchanged. The hold slack is not changed by a late derate.
Summary
- IR drop is the voltage lost in the power grid. It differs from cell to cell and is larger where many cells switch.
- A lower voltage at the cell means less current and a longer delay.
- The library corner voltage is global. The IR drop is a local effect on top of it.
- A late derate on one cell models its extra delay: 10 percent on the XOR gate lowers the setup slack from 1.4502 ns to 1.4357 ns.
- A flow takes the voltage of each cell from a power analysis and converts it into delay changes.
- The cause of an IR-drop problem is in the power grid, so fix it there.
