
STA tools can analyze a design in two ways. Graph-based analysis keeps one value per pin of the timing graph. It is fast, and it is safe, but it can be pessimistic. Path-based analysis takes one path at a time and calculates it with the values that belong to that path. It is slower and more accurate. This article explains the difference with the example of the slew merging that was shown earlier, with the numbers of both methods, and shows how a flow uses them together.
8 min read | Intermediate
What You'll Learn
- Explain how graph-based analysis stores one value per pin
- Say where the pessimism of graph-based analysis comes from
- Calculate the path-based slack of a path from its own slews
- Describe how a flow combines the two methods
Graph-Based Analysis
As the article about timing graphs explained, STA does not list all the paths of a design. It walks through the timing graph and keeps, at each pin, a value: the latest arrival time, the earliest arrival time, and the worst slew. A path report is then built by following the best predecessor at each pin. The work grows with the size of the graph, and not with the number of paths, which is why STA can handle very large designs.
The price is that a value at a pin combines the effect of all the paths that arrive there. The worst slew at a pin may come from one path, and it is used for every path that goes through the pin, including the ones that do not have it. This is the slew merging of the article about slew propagation.
Where the Pessimism Comes From
Take the XOR gate of the demo circuit, which has two inputs, one from the first flip-flop and one from the input port c. If the port c has a very slow edge (a slew of 1.0 ns), the output of the XOR gate gets a merged slew of 0.1527 ns, the worst of its two arcs. The path from the flip-flop does not see the slow edge of c, but its slew at the data pin of the next flip-flop is still 0.1527 ns, and the setup time grows because of it:
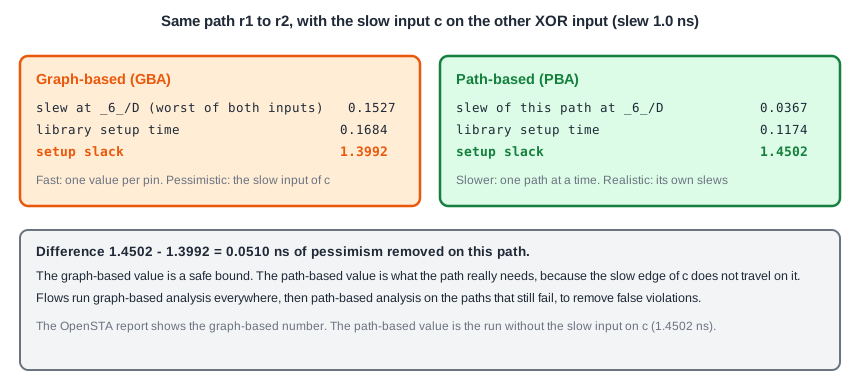
In the report of the graph-based analysis, the path has a setup time of 0.1684 ns and a slack of 1.3992 ns. If you take only this path, and calculate it with its own slews, the slew at the data pin is 0.0367 ns, the setup time is 0.1174 ns, and the slack is 1.4502 ns. The difference of 0.0510 ns is the pessimism of the merge. The path-based number is the same as the number from a run in which the port c has no slow edge, because that edge does not travel on this path.
Path-Based Analysis
A path-based analysis picks a path and recomputes its delays with the slews and the other values that belong to it alone. The same applies to the crosstalk effects and to the common path pessimism, which can be calculated for the real launch and capture paths instead of a worst case. The result is smaller pessimism and a slack that is closer to the truth. It takes more run time, because it handles each path separately, and a design has many more paths than pins.
The graph-based number is always a safe bound. If a path passes in graph-based analysis, it passes in path-based analysis too. The reverse is not true: a path that fails in graph-based analysis can pass when it is calculated alone.
Using Both
- Run graph-based analysis on the whole design. It is fast, and it gives the list of paths that fail.
- Run path-based analysis on the failing paths only, usually the worst few thousand, or all the paths within some margin of zero.
- Fix the paths that still fail in the path-based result. Those are the real violations. The others were pessimism.
This saves a lot of effort in the fixing steps: the team does not add cells for violations that do not exist. Sign-off often requires the path-based result for the paths that fail in the graph-based run.
What the Tutorial Runs Show
The OpenSTA runs in this tutorial give the graph-based numbers. The path-based number in the example is derived from the run without the slow input on c, which is the same path with its own slews. A tool with a path-based mode reports it directly, and it also reports the larger gains on paths with many merging points.
Common Mistakes
Mistake #1: Fixing every graph-based violation
Some of them are pessimism. Check the failing paths with the path-based analysis first, or you spend area and time on violations that cannot happen.
Mistake #2: Trusting a path-based pass without the full set of checks
The path-based number is more accurate for one path. It does not replace the analysis of the other paths and corners, and it does not remove real violations.
Quick Check: A path has a graph-based slack of -0.02 ns and a path-based slack of +0.03 ns. Is it a real violation?
No. The path-based value is the more accurate one, and it is positive. The violation was pessimism of the graph-based analysis.
Practice Exercise
Challenge: Remove the Pessimism by Hand
Use the sta_demo design with the basic constraints and add a slow edge to the input c:
set_input_transition 1.0 [get_ports c]
The graph-based setup slack of the path from _7_ to _6_ becomes 1.3992 ns. Predict the path-based slack of the same path, then run the design without the command and compare.
Open the ready-made example in the lab, run synthesis, and then run STA. Editing constraints.sdc and re-running only STA, and choosing another library or corner, are PRO features.
Hint
The path from the flip-flop does not pass the port c. Which slew does it have at the data pin when c is not slow?
Solution
The path-based slack is the slack without the slow edge, 1.4502 ns. The pessimism of the graph-based analysis is 1.4502 - 1.3992 = 0.0510 ns. The path from the input c itself is different: it really has the slow edge, and its slack of 1.0500 ns is the same in both methods.
Summary
- Graph-based analysis keeps one value per pin and handles large designs quickly.
- A value at a merge point, such as the worst slew, is used for every path through the pin, which adds pessimism.
- Path-based analysis recomputes one path with its own slews and other values.
- In the example, the graph-based slack is 1.3992 ns and the path-based slack is 1.4502 ns, so 0.0510 ns of pessimism is removed.
- The graph-based result is a safe bound, and the path-based result is more accurate.
- Flows run the graph-based analysis everywhere and the path-based analysis on the failing paths.
