
Silicon correlation compares what the chip actually does with what the pre-silicon tools predicted: path delays from static timing analysis, ring oscillator frequencies from circuit simulation, and power from power analysis. Where they agree, the models can be trusted for the next design; where they disagree, something in the models or the flow is wrong. This article explains what is correlated, how the comparisons are made, and what teams learn from the differences.
6 min read | Advanced
What You'll Learn
- List the main pre-silicon predictions that are checked on silicon
- Read a predicted versus measured correlation plot
- Explain what systematic offsets and outliers mean
- Describe how correlation results feed back into sign-off
What Gets Correlated
- Process monitors: ring oscillator frequencies against circuit simulation at the measured process point. This checks the transistor models themselves.
- Path delays: the paths that limit Fmax on silicon against the paths static timing analysis called critical.
- Maximum frequency: measured Fmax against the frequency timing analysis predicted at the same voltage and temperature.
- Power: measured dynamic and leakage power against power analysis, as in Power and Thermal Validation.
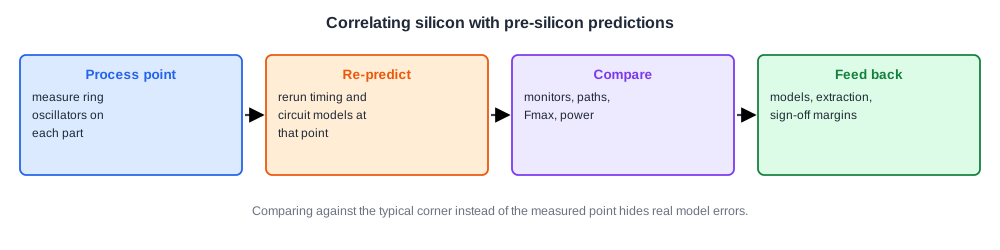
The key step is putting predictions and measurements on the same footing. A part from a fast wafer should be compared with models at that wafer's process point, not at the typical corner. Ring oscillators and test structures provide that point.
Reading a Correlation Plot
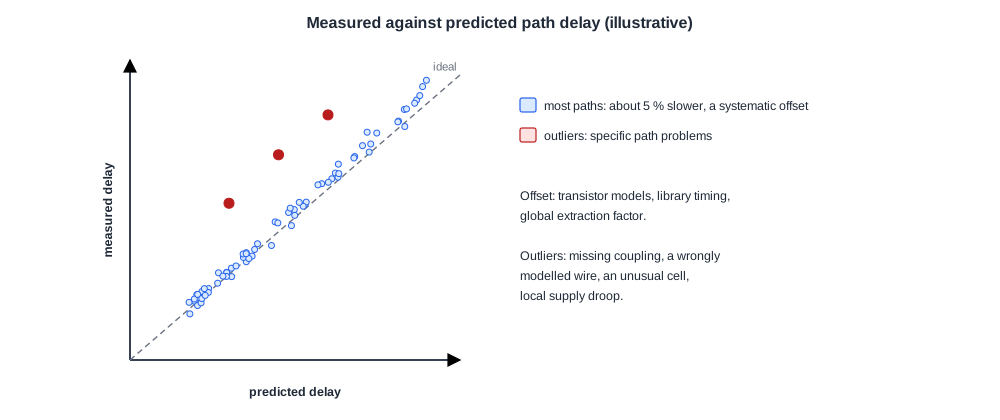
Plotting measured against predicted values for many paths or many parts shows three things:
- Agreement: points close to the diagonal mean the models predict well.
- A systematic offset: all points shifted the same way, for example silicon 4 % slower than predicted. This usually points to the transistor models, the library characterization, or a global extraction factor.
- Outliers: a few paths far from the rest. These point to something specific to those paths: missing coupling, a wire modelled wrongly, an unusual cell, or local supply droop.
Quick Check
Q: All measured paths are about 5 % slower than predicted, by the same proportion. Is the likely cause a single badly routed wire?
Show Answer
No. A single wire would affect only the paths through it. A uniform offset across all paths points to something global, such as the transistor models, the library timing, or a process point placed wrongly in the comparison.
Paths That Should Not Be Critical
A frequent finding is that the path limiting silicon speed is not near the top of the timing report. Timing analysis said it had plenty of slack, yet on silicon it fails first.
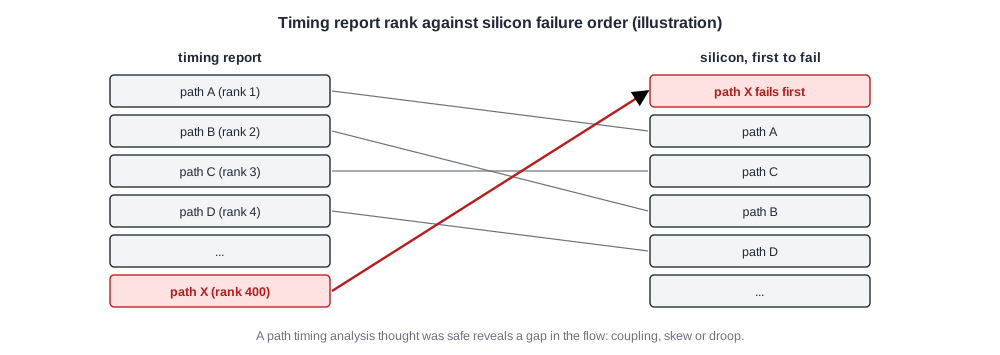
Such paths are the most valuable result of correlation. Each one shows a gap in the flow, for example a coupling effect not modelled, a clock skew assumption that was wrong, or a dynamic droop region. Fixing the flow prevents the same gap in every future design.
Quick Check
Q: A path ranked 400th in the timing report fails first on silicon, and only when a nearby block is busy. What effect should be suspected?
Show Answer
Local supply droop or noise from the nearby block, which static timing at a fixed voltage does not capture. Checking the path at different workloads and looking at droop monitors near it would confirm it.
In Practice
Correlation results feed back into the next tapeout and the next design: updated transistor models, adjusted extraction, new margins for coupling or droop, and checks added to the sign-off flow. They also explain the current product's behaviour, guiding which paths a metal fix should target, as covered in Speedpaths.
Common Mistakes
Mistake #1: Comparing silicon with typical-corner models
Place each part at its own process point using the monitors first.
Mistake #2: Averaging away the outliers
Outlier paths reveal specific gaps in the flow. Investigate each one.
Mistake #3: Treating correlation as a one-time report
Feed the results back into models and sign-off so the next design benefits.
Practice Exercise
Challenge: Separate the Effects
Timing predicts Fmax of 2.0 GHz at the measured process point. Silicon reaches 1.88 GHz.
The ring oscillators measure 3 % slower than circuit simulation at the same point. How much of the shortfall do the transistor models explain, and how much remains?
Hint
Compute the total shortfall as a percentage first.
Solution
The shortfall is (2.0 - 1.88) / 2.0 = 6 %. Slower transistors explain about 3 %, so roughly 3 % remains, from something else: wires, coupling, clock skew or droop. The limiting paths should be examined to find which.
Summary
- Correlation compares measured monitors, paths, Fmax and power with pre-silicon predictions.
- Predictions must be made at each part's measured process point.
- Uniform offsets point to global model errors; outliers point to specific path problems.
- Results feed back into models, extraction and sign-off margins.
