
Characterization measures a parameter, such as Fmax, minimum voltage or leakage, on many parts and describes the result statistically. One good part proves little; the shape of the distribution, its spread and its outliers tell the team whether production will meet the specification. This article covers the statistics that matter in practice: mean and spread, process capability, wafer maps, and how outliers are found and screened.
7 min read | Intermediate
What You'll Learn
- Describe a measured distribution by its mean and standard deviation
- Compute a process capability index from limits and spread
- Read wafer maps for spatial patterns
- Identify outliers and explain how they are screened
Distributions
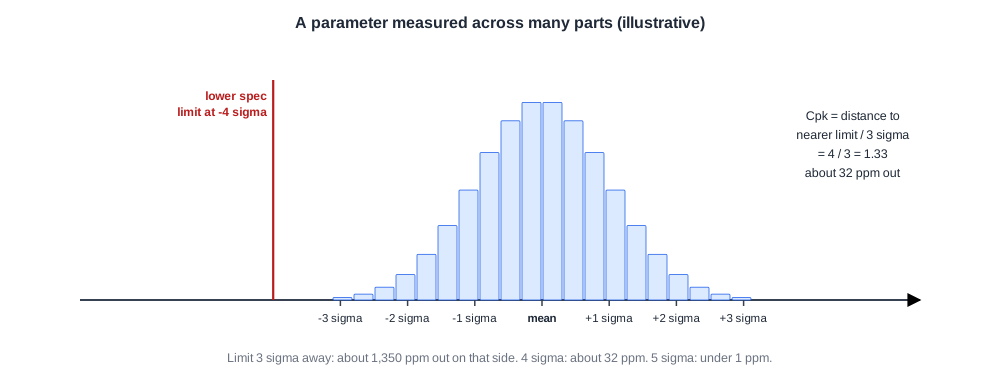
A parameter measured across many parts forms a distribution. For many electrical parameters it is close to normal, described by its mean and its standard deviation, sigma.
The question is always where the specification limit sits relative to the distribution. A limit three sigma from the mean leaves about 1.3 parts per thousand outside it on that side; a limit at four and a half sigma leaves only a few parts per million. Leakage is the usual exception: it is skewed, with a long tail of leaky parts.
Process Capability
A common summary is the process capability index, Cpk: the distance from the mean to the nearer specification limit, divided by three sigma.
- Cpk = 1.0: the nearer limit is 3 sigma away, about 1,350 ppm outside on that side.
- Cpk = 1.33: 4 sigma away, about 32 ppm.
- Cpk = 1.67: 5 sigma away, well under 1 ppm.
Many teams target a Cpk of at least 1.33 for key parameters, consistent with the low defect levels a production release needs.
Quick Check
Q: Minimum voltage has a mean of 0.72 V and sigma of 0.02 V. The specification requires parts to work at 0.80 V. What is Cpk?
Show Answer
The limit is an upper one here: parts must have a minimum voltage below 0.80 V. Cpk = (0.80 - 0.72) / (3 x 0.02) = 0.08 / 0.06 = 1.33.
Wafer Maps
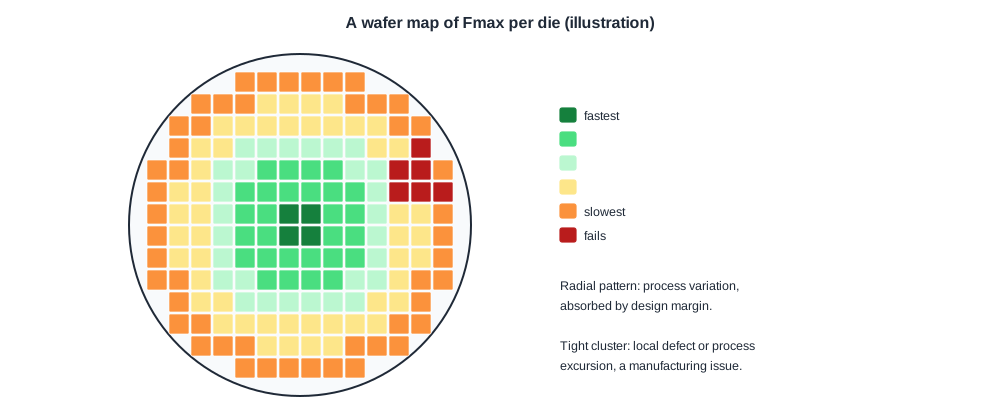
Plotting each die's result at its position on the wafer often shows patterns: faster die in the centre and slower at the edge, a gradient across the wafer, or a cluster of failures in one area.
Patterns separate causes. A smooth radial pattern points to process variation, which design margin has to absorb. A tight cluster of failures points to a local defect or a process excursion, a manufacturing issue rather than a design weakness.
Outliers
Some parts sit far from the rest, not because of normal variation but because they contain a defect that changes their behaviour slightly. They may pass every test today and fail early in the field.
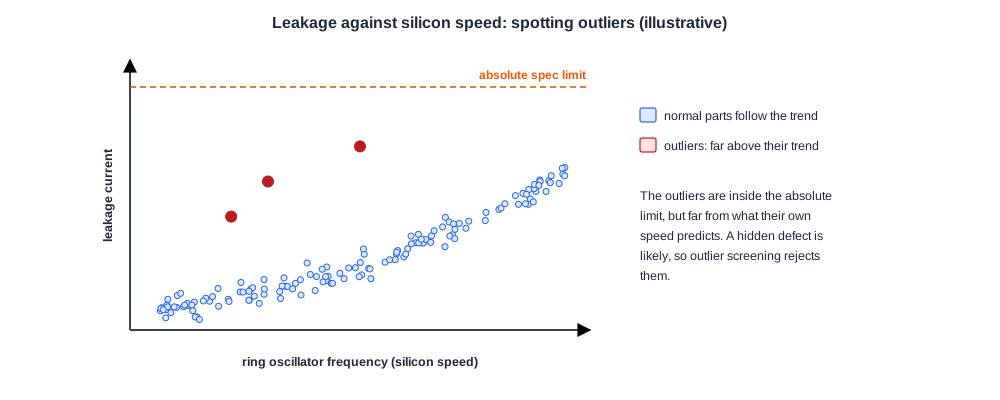
Outliers are easiest to see against a related measurement. Leakage normally tracks transistor speed, so a part with far more leakage than its ring oscillator predicts is suspicious, even if its leakage is within the specification. Production test uses this idea in outlier screening: limits are set relative to the population, for example each wafer's own distribution, and parts far from it are rejected even when they meet the absolute limit.
Quick Check
Q: Why reject a part whose leakage is within the specification?
Show Answer
Because it is far above what its own process point predicts. That extra leakage often comes from a defect, such as a weak short, which may grow and fail in the field. Screening such outliers reduces early field failures at the cost of a small yield loss.
In Practice
Characterization data is stored in large databases that link every measurement to the part, wafer, lot and test conditions. Engineers slice it by any of these to find trends. The same statistics are used throughout this chapter: skew-lot results, Fmax distributions and guard band decisions all depend on them, and they continue in production as described in Yield and Field Returns.
Common Mistakes
Mistake #1: Drawing conclusions from a handful of parts
Sigma and tails need many parts. Small samples hide the spread.
Mistake #2: Assuming every parameter is normal
Leakage and some failure rates are skewed. Look at the real shape before using normal tables.
Mistake #3: Ignoring the wafer position of failures
Spatial patterns separate design weaknesses from manufacturing problems.
Practice Exercise
Challenge: Capability of Fmax
Fmax has a mean of 2.6 GHz and sigma of 0.05 GHz. The specification requires at least 2.4 GHz.
What is Cpk? If the mean drifts down to 2.5 GHz with the same sigma, what is Cpk, and roughly how many parts per million fail?
Hint
Cpk = (mean - lower limit) / (3 sigma).
Solution
(2.6 - 2.4) / 0.15 = 1.33, about 32 ppm below the limit. After the drift, (2.5 - 2.4) / 0.15 = 0.67, so the limit is only 2 sigma away and about 2.3 % of parts, 23,000 ppm, fail. A small drift in the mean has a large effect on the tail.
Summary
- Characterization describes parameters across many parts by mean, spread and shape.
- Cpk relates the spread to the nearer specification limit; 1.33 means 4 sigma.
- Wafer maps separate process variation from local defects.
- Outliers are found against related measurements and screened relative to the population.
