
On-chip trace records what selected signals or processors do, cycle by cycle, while the chip runs at full speed. Because a debug port is far too slow to stream that data out live, the samples go into a small on-chip memory called a trace buffer, or out through a dedicated high-speed trace port, and are read afterwards.
The buffer is small, so two decisions shape its usefulness: which signals to trace, decided before tapeout, and when to keep the samples, decided by triggers in the lab. This article explains how trace buffers work, how signals are chosen, how triggers and cross-triggers work, and how processor trace differs from signal trace.
8 min read | Intermediate
What You'll Learn
- Explain why trace is stored on-chip instead of streamed through the debug port
- Size a trace buffer and the window it captures
- Describe how trace signals are chosen and how untraced values can be restored
- Use triggers and cross-triggers to capture the right window
Why a Trace Buffer
A chip running at a gigahertz produces a new value of every signal every nanosecond. A JTAG port at a few megahertz moves one bit per clock.
Streaming even one signal live is therefore impossible, let alone a hundred. Trace instead writes the selected signals into on-chip memory at full speed, and the debugger reads that memory slowly afterwards.
The memory costs area and power, and every traced signal must be routed to it, which can cause congestion. So trace buffers are small compared with the design.
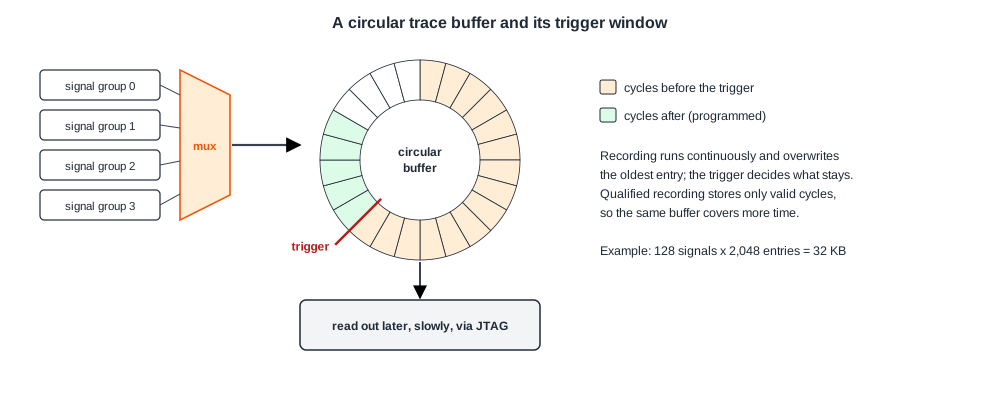
A typical buffer holds a few hundred signals for a few thousand cycles. A buffer 128 bits wide and 2,048 entries deep, for example, stores 128 signals over 2,048 cycles: 262,144 bits, or 32 kilobytes.
Circular Buffers and the Trigger Window
The buffer is written as a ring: when it is full, the oldest entry is overwritten. Recording runs continuously and a trigger decides when to stop.
If recording stops as soon as the trigger fires, the buffer holds the cycles before the trigger; if it continues for a programmed number of cycles, the window is split between before and after. This matters because the cause of a failure usually happens before the symptom: a bad write some time before the wrong read, a lost request before the timeout.
Triggers can be simple, such as a match on an address or a state, or sequences: event A, then event B within a number of cycles. They can also qualify recording: store a sample only when a valid bit is set, so the buffer fills with useful transactions instead of idle cycles. A typical tool request is "trace signal S only when register R holds value u", set up through the configuration software.
Quick Check
Q: A trace buffer holds 2,048 cycles. The symptom is a timeout that fires 10,000 cycles after the request that was lost. Can the buffer capture the lost request if it triggers on the timeout?
Show Answer
Not directly: the request happened 10,000 cycles before the trigger, outside a 2,048-cycle window. Options are a trigger on an earlier event closer to the cause, qualified recording that stores only request and response transactions so the window covers more time, or a two-stage trigger that arms on the request type and fires when the matching response does not arrive within a few cycles.
Choosing the Signals
A design has millions of signals and the buffer takes a few hundred, chosen before anyone knows which bugs silicon will show. Two ideas guide the choice:
- Functional knowledge. Designers choose signals at interfaces, arbitration points, queue controls, state machines and clock-domain crossings, where bugs tend to appear. Many chips trace groups of signals through a multiplexer, so engineers can choose in the lab which group of a larger set to record.
- Restorability. The values of some untraced signals can be computed from traced ones. If one input of an AND gate is traced as 0, its output was 0 in that cycle (forward restoration); if the output of a flip-flop fed by an AND gate is 1, both inputs were 1 in the previous cycle (backward restoration).
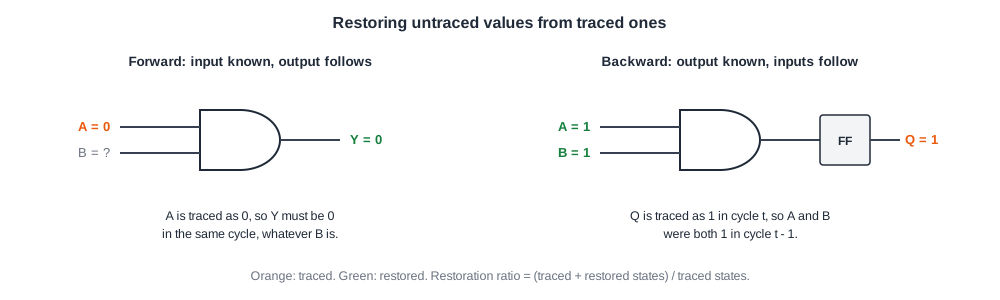
Restorability is measured with the state restoration ratio:
restoration ratio = (traced states + restored states) / traced states
If 2 signals are traced for 5 cycles, 10 states are known directly; if 16 more can be worked out from them, the ratio is (10 + 16) / 10 = 2.6. Research tools select signals to maximize this ratio, using structural analysis, simulation, or combinations of the two. In industry, experience and functional knowledge still dominate, because the ratio ignores which signals matter for a feature and the physical cost of routing them.
Processor Trace
Processors usually have trace units of their own, which record the program flow rather than raw signals. Because most instructions follow each other in order, a program-flow trace only needs to record branches taken or not taken and the targets of indirect jumps; a decoder on the host combines that with the program binary to reconstruct every instruction executed.
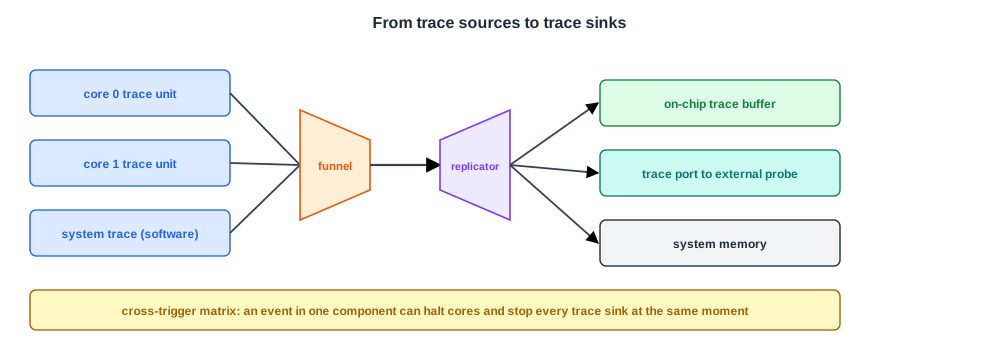
That compression makes it possible to stream processor trace out through a trace port, or into system memory, for long periods. In ARM's CoreSight architecture each core's trace macrocell produces this stream; software can also write messages into a system trace unit to mark its own events.
Trace from several sources is merged and routed by a trace interconnect: funnels combine streams, replicators copy one stream to two destinations, and trace sinks store it in an on-chip buffer, send it out through a trace port to an external probe, or write it to system memory.
Cross-Triggering
A failure in one block often needs data from another. Cross-trigger interfaces pass debug events between components: when a watchpoint fires on one core, the cross-trigger matrix can halt the other cores, stop the trace buffers and freeze the interconnect trace, all within a few cycles, so every recording shows the same moment. Most systems have one cross-trigger interface per processor and at least one for system-level components.
Quick Check
Q: Why can processor program-flow trace be streamed off-chip for minutes, while raw signal trace fills a buffer in microseconds?
Show Answer
Program-flow trace is heavily compressed: it records only branch outcomes and indirect targets, and the host reconstructs the rest from the program binary. Raw signal trace records every chosen bit on every cycle with no way to predict it, so its data rate is many times higher and only a short window fits in on-chip memory.
In Practice
Debugging with trace is iterative. The first capture shows roughly where the failure happens, the trigger is moved closer to the cause, the signal group is changed to the block that looks suspicious, and the capture is repeated, often hundreds of times.
Because silicon is fast, each repetition takes seconds; most of the time goes into choosing the next trigger and reading the result. Good analysis software, which turns raw bits back into transactions and timelines, is what makes this loop fast.
Common Mistakes
Mistake #1: Triggering on the symptom only
The cause is usually earlier than the symptom and outside a short window. Trigger closer to the cause or qualify recording to stretch the window.
Mistake #2: Tracing signals without their valid bits
A data bus without its valid or enable signal cannot be interpreted. Trace qualifiers with the data they qualify.
Mistake #3: Choosing trace signals without the block designers
The designers know which internal states explain their block's behaviour. Ask each team for its most important signals.
Practice Exercise
Challenge: Size the Window
A trace buffer is 256 bits wide and 4,096 entries deep. A bus interface produces a 200-bit transaction record, but only in 1 cycle out of 16 on average.
How many cycles does the buffer cover if it stores every cycle, and how many if it stores only cycles with a valid transaction? What is the buffer size in kilobytes?
Hint
Each entry stores one cycle's record.
Solution
Storing every cycle covers 4,096 cycles. Storing only valid transactions covers 4,096 transactions, about 4,096 x 16 = 65,536 cycles on average, sixteen times longer. The buffer holds 256 x 4,096 = 1,048,576 bits, which is 128 kilobytes.
Summary
- Trace stores selected signals at full speed in on-chip buffers, because debug ports are far too slow to stream them.
- Buffers are circular; triggers decide when recording stops and how much is kept before and after.
- Typical buffers hold a few hundred signals for a few thousand cycles; qualified recording stretches the window.
- Signals are chosen from functional knowledge and restorability, measured by the state restoration ratio.
- Processor trace records compressed program flow; cross-triggers synchronize capture across blocks.
