
Fmax is the highest clock frequency at which a particular part works correctly at a given voltage and temperature. Because every part is slightly different, Fmax forms a distribution across production, and many products are sold in speed bins: faster parts as one product, slower parts as another.
Validation measures that distribution, finds what limits it, and helps set the bins and test conditions. This article explains how Fmax is measured, how binning works, and how per-part voltage settings fit in.
6 min read | Intermediate
What You'll Learn
- Define Fmax and explain why it varies between parts
- Estimate the share of parts in each speed bin from a distribution
- Describe how parts are sorted into bins in production
- Explain per-part voltage settings and adaptive voltage scaling
Measuring Fmax
Fmax is found by running a demanding test at fixed voltage and temperature while raising the clock frequency until the test fails. The last passing frequency is the part's Fmax for that test.
The test matters a great deal. A test that never exercises the slowest paths reports a higher Fmax than the part can really sustain. Validation therefore identifies the paths that limit speed, as described in Speedpaths, and makes sure the production speed test covers them.
The Fmax Distribution
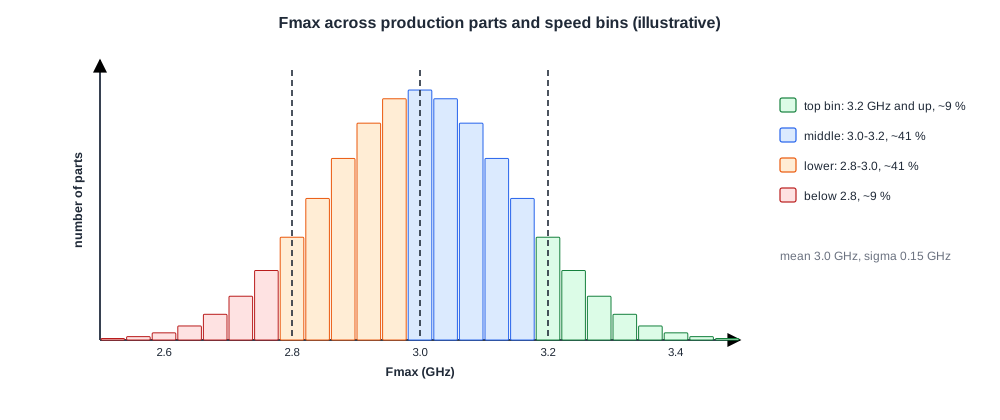
Measured over many parts, Fmax spreads out because transistor speed, wire resistance and threshold voltage vary across wafers and lots. The spread is often close to a normal distribution, characterized by its mean and standard deviation.
That distribution drives the business. If the product needs 3.0 GHz and the mean is 3.0 GHz, only half the parts qualify. Validation data shows where the mean sits and how wide the spread is, which tells the team whether the target is realistic.
Quick Check
Q: Fmax is roughly normal with a mean of 3.0 GHz and a standard deviation of 0.15 GHz. About what fraction of parts reach 3.3 GHz?
Show Answer
3.3 GHz is two standard deviations above the mean, so about 2.3 % of parts. A top bin at that speed would be a small, premium product.
Binning
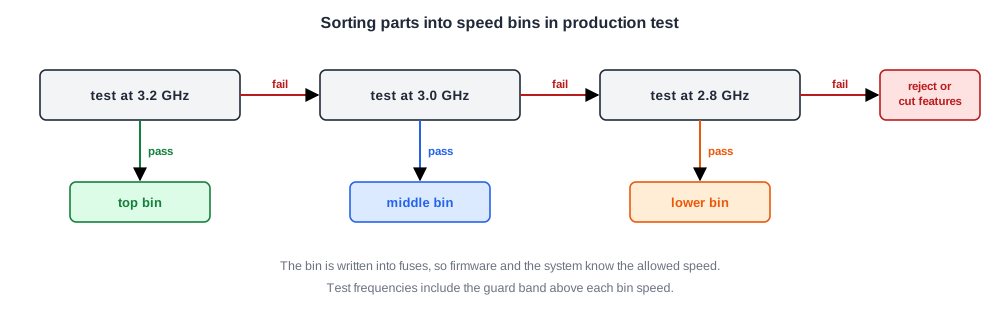
In production, each part runs the speed test at the highest bin frequency. If it passes, it goes into that bin.
If it fails, it is tested at the next lower frequency, and so on. Parts that fail the lowest bin may be sold with features disabled or scrapped.
The bin decision is stored in fuses on the part, so the firmware and the system know at what speed it may run. Binning only works if the production test conditions include enough margin for aging, temperature and voltage drop in a real system, the subject of Margins and Guard Bands.
Per-Part Voltage
Instead of running every part at the same voltage, many chips store a per-part voltage, or a voltage-frequency table, in fuses. A fast part can meet the target frequency at a lower voltage, saving power; a slow part gets a slightly higher voltage to reach the same speed.
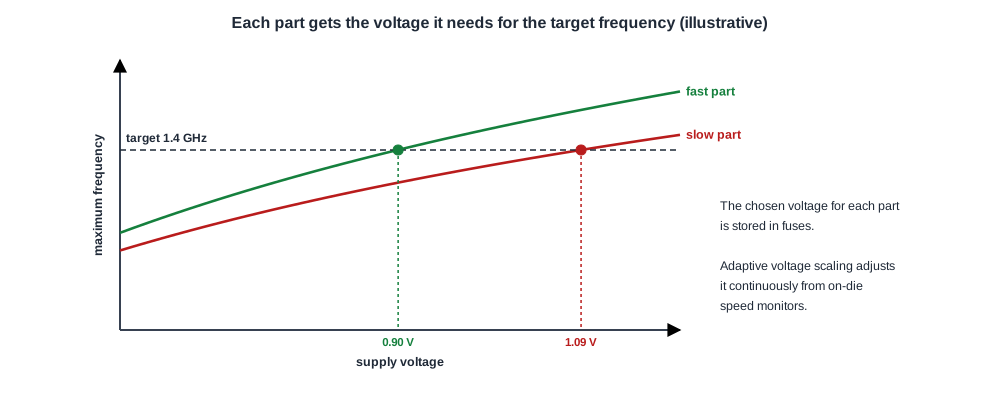
Some systems go further with adaptive voltage scaling: on-die monitors measure the silicon speed in operation and the voltage is adjusted continuously. Either way, validation checks that every part, at its chosen voltage, still has margin under the worst workloads.
Quick Check
Q: Why does giving fast parts a lower voltage save more power than it first seems?
Show Answer
Fast parts are also the leakiest. Lowering their voltage cuts dynamic power with the square of voltage and cuts leakage even more steeply, which brings down exactly the parts that set the worst-case power.
In Practice
Bin plans are set jointly by marketing and engineering using validation's Fmax data from skew lots and early production. They are revisited as the process matures, since a process that improves can shift the distribution and move more parts into the top bin. Validation also checks that each bin's parts pass functional, power and thermal limits, not only the speed test.
Common Mistakes
Mistake #1: Measuring Fmax with a test that misses the critical paths
The result looks better than reality. Use tests that exercise the known speedpaths.
Mistake #2: Setting bins from a few early parts
Early parts may not represent production. Use skew lots and many parts.
Mistake #3: Lowering voltage on fast parts without re-checking margin
Each per-part voltage needs its own margin under worst-case workloads.
Practice Exercise
Challenge: Bin Shares
Fmax is normal with a mean of 3.0 GHz and a standard deviation of 0.15 GHz. Bins are at 3.2, 3.0 and 2.8 GHz.
Estimate the share of parts in each bin and below the lowest. Assume about 9 % of a normal distribution lies more than 1.33 standard deviations above the mean.
Hint
3.2 and 2.8 GHz are each 1.33 standard deviations from the mean.
Solution
About 9 % reach 3.2 GHz. Between 3.0 and 3.2 GHz lies 50 - 9 = 41 %.
Between 2.8 and 3.0 GHz is another 41 %. About 9 % fall below 2.8 GHz and fail every bin. A shift of the mean upward by process improvement would move many parts into higher bins.
Summary
- Fmax is the highest working frequency of one part under given conditions and test.
- Fmax varies between parts, forming a distribution with a mean and spread.
- Binning tests parts from the top speed down and records the result in fuses.
- Per-part voltages and adaptive voltage scaling trade speed for power part by part.
