
Power and thermal validation measures how much power the chip really uses and how hot it gets, under idle, typical and worst-case workloads. The results decide battery life, cooling, the package and the power delivery of every product board.
They also check the pre-silicon power estimates, which are never perfect. This article covers how power is measured, how leakage and dynamic power are separated, and how die temperature is found and managed.
7 min read | Intermediate
What You'll Learn
- Measure power on each supply rail
- Separate leakage from dynamic power
- Explain how voltage, frequency and temperature change power
- Estimate junction temperature from power and thermal resistance
Measuring Power
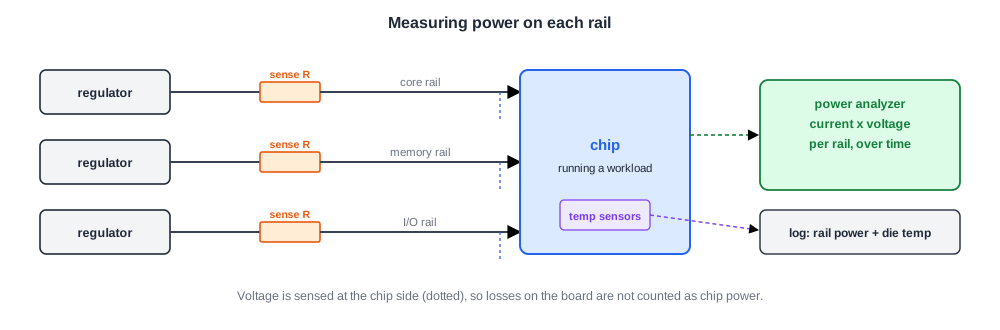
Power is measured per supply rail as current times voltage. Debug boards have a sense resistor or a power analyzer channel on each rail, and the voltage is sensed close to the chip so that board losses are excluded.
Measurements are taken while known workloads run: idle, each power state, typical applications, and worst-case "power virus" tests designed to switch as much logic as possible. Each result is stored with the die temperature, from the on-die sensors of Monitors on the Die.
Leakage and Dynamic Power
Total power has two main parts:
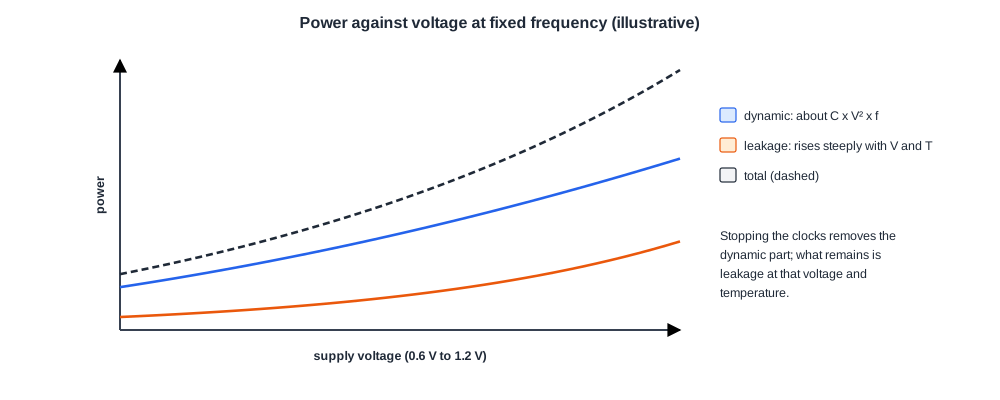
- Dynamic power, from charging and discharging capacitance as gates switch. It scales roughly as C x V2 x f: with the switched capacitance, the square of the voltage and the frequency.
- Leakage power, which flows even when nothing switches. It rises steeply with temperature and voltage, and varies a lot between fast and slow parts.
A simple way to separate them is to stop the clocks: what remains is leakage, at that temperature and voltage. Repeating at several temperatures shows how fast leakage grows with heat, which matters because a hot chip leaks more, which heats it further.
Quick Check
Q: A block uses 400 mW of dynamic power at 1.0 V and 1 GHz. Roughly what dynamic power does it use at 0.8 V and 800 MHz?
Show Answer
Dynamic power scales with V2 x f: 400 x 0.82 x 0.8 = 400 x 0.512, about 205 mW. Lowering voltage and frequency together roughly halves the dynamic power here, which is why voltage and frequency scaling saves so much.
Comparing With the Estimates
Pre-silicon power estimates rely on switching activity from simulation, library power models and extracted capacitance. Silicon shows how good they were. Large differences point to real problems: a block whose clock gating does not work, a power state that leaves something on, leakage much higher than modelled. Correlating Silicon with Pre-Silicon Timing and Power covers this comparison in detail.
Temperature
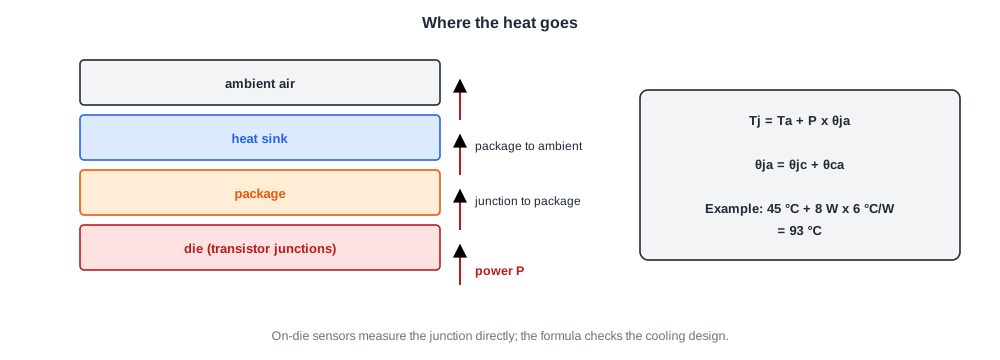
Heat flows from the transistors through the die, package and heat sink into the air. The junction temperature rise is the power times the thermal resistance from junction to ambient.
Validation measures this directly with on-die temperature sensors rather than trusting the model. It runs worst-case workloads at the highest ambient temperature to check that the junction stays within its limit, and checks that thermal protection such as throttling engages when it should. Thermal test setups use forcing units or chambers to hold the chip at a chosen temperature regardless of its own power, so that other measurements can be made at controlled temperatures.
Quick Check
Q: A chip dissipates 8 W with 6 °C/W from junction to ambient, in a 45 °C box. What is the junction temperature, and is it below a 100 °C limit?
Show Answer
45 + 8 x 6 = 93 °C, below the limit by 7 °C. The margin is small: higher leakage on a fast part or a hotter box could push it over, so the worst case must be measured on fast-corner parts at the highest ambient.
In Practice
Power results feed many decisions: the voltage and frequency of each power state, the power limits programmed into firmware, the thermal design guidance given to customers, and sometimes the speed bins themselves, since a fast part may also leak more. Power is therefore measured on parts across the process, from slow to fast, not just on typical ones.
Common Mistakes
Mistake #1: Measuring voltage at the supply instead of at the chip
Board losses then appear as chip power. Sense voltage close to the chip.
Mistake #2: Ignoring temperature when comparing power
Leakage depends strongly on temperature. Record die temperature with every measurement.
Mistake #3: Characterizing power on typical parts only
Fast parts leak more. Measure across the process spread.
Practice Exercise
Challenge: Separate the Parts
At 70 °C a chip draws 1.8 W with a workload running and 0.5 W with all clocks stopped, at the same voltage. What are the dynamic and leakage power?
If leakage doubles for every 25 °C rise, what is the total power at 95 °C with the same workload? The doubling rule is an assumption for the exercise.
Hint
Clocks stopped leaves only leakage.
Solution
Leakage 0.5 W, dynamic 1.3 W. At 95 °C leakage doubles to 1.0 W, so total power is 2.3 W, 28 % more for the same work. The extra heat raises the temperature further, which is why thermal validation looks at the hottest conditions on the leakiest parts.
Summary
- Power is measured per rail, with voltage sensed at the chip, under idle, typical and worst-case workloads.
- Dynamic power scales with C x V2 x f; leakage grows with temperature and voltage and is found by stopping the clocks.
- Comparing silicon with estimates finds broken clock gating, leaky power states and model errors.
- Junction temperature is ambient plus power times thermal resistance; on-die sensors measure it directly.
