
The power grid that carries VDD and GND across a chip is made of metal, and metal has resistance. When logic draws current through that resistance, the supply voltage at the logic sags - this is IR drop, directly from Ohm's law. Gates far from the power pads, or in areas where many gates switch at once, see a lower effective supply, switch more slowly, and can fail timing. Power-grid design and IR drop analysis make sure every cell gets enough voltage.
13 min read | Intermediate Level
What You'll Learn
- Why current through the power grid lowers the supply voltage at each cell
- The difference between static and dynamic IR drop, and ground bounce
- How IR drop turns into extra delay and timing failures
- How power grids, decap cells, and design choices about switching activity keep IR drop in budget
Ohm's Law on the Power Grid
Power reaches a cell through pads or bumps, wide rings and straps on the upper metal layers, and finally the thin power rails that run along each row of standard cells. Every piece has resistance, and every milliamp drawn by the cells flows through it.
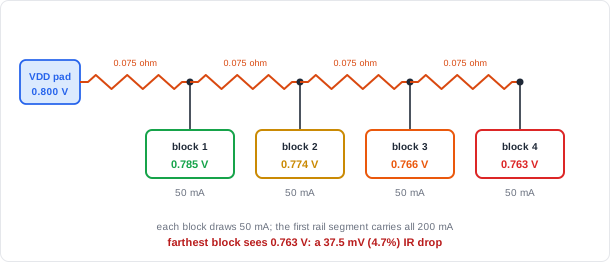
IR drop in proportions

  voltage drop = current x resistance of the path from the pad

  more current drawn           -> more drop
  more resistance (farther from pad, thinner metal, fewer straps) -> more drop
  segments near the pad carry the current of everything beyond them

  the GND network has the same problem in reverse:
  current flowing back raises the local ground ("ground bounce")

  effective supply at a cell = local VDD - local GND
Quick Check
Q: A block draws 300 mA through a path with 0.1 ohm of resistance to the VDD pad, and its return current sees 0.05 ohm to the ground pad. With a 0.8 V supply, what effective voltage does the block see?
Show Answer
VDD sags by 0.3 x 0.1 = 30 mV, and local ground rises by 0.3 x 0.05 = 15 mV. The effective supply is 0.8 - 0.030 - 0.015 = 0.755 V, a 45 mV (about 5.6%) loss.
Static vs. Dynamic IR Drop
| Type | Based on | Shows | Typical fix |
|---|---|---|---|
| Static | Average current over time | Weak spots in the grid's overall resistance | More or wider straps, more pads or bumps |
| Dynamic | Instantaneous current when many cells switch at once, often right after a clock edge | Local, short-lived voltage dips around busy logic | Decoupling capacitance nearby, spreading out high-activity logic |
Dynamic drop is often the harder problem. A burst of simultaneous switching draws a current spike that the distant pads cannot supply instantly. Decoupling capacitors (decap cells) placed close to the logic act as small local reservoirs that supply charge during the spike. Their required total is commonly several times the switching capacitance they support.
Why IR Drop Causes Timing Failures
A cell's speed depends on its overdrive, the supply voltage above its transistor threshold. A small drop in supply is a larger relative drop in overdrive, so delay rises by a larger percentage than the voltage falls.
Delay impact of IR drop (illustrative, near-linear drive current)

  VDD = 0.80 V, Vth = 0.30 V   -> overdrive = 0.50 V
  40 mV IR drop (5% of VDD)    -> overdrive = 0.46 V   (8% less)
                               -> drive current ~8% lower
                               -> cells on that path ~8% slower

  A path with 60 ps of slack and 800 ps of delay loses ~64 ps -> now fails.
IR drop also eats into noise margins, because a driver and a receiver in different parts of the chip see different local rails. Sign-off flows therefore run timing with the actual voltage each cell receives, not the nominal supply.
Where Is IR Drop a Major Concern?
High-performance processors and AI accelerators draw tens to hundreds of amperes at supplies below 1 V, so even a few milliohms of grid resistance costs significant voltage. These chips use flip-chip packages with thousands of power bumps spread across the whole die rather than only at the edges, dense upper-metal power meshes, and large amounts of on-die decoupling capacitance. Typical design budgets keep total supply noise to within about 10% of VDD, and often much less.
Fixing IR Drop
| Fix | What it changes | Cost |
|---|---|---|
| Wider or denser power straps | Lowers grid resistance | Routing resources for signals |
| More pads or bumps, spread across the die | Shortens the path from supply to cell | Package cost, pad area |
| Decap cells near busy logic | Supplies charge during switching spikes | Area and some leakage |
| Spreading high-activity logic out | Avoids concentrated current hot spots | Placement constraints, wire length |
| Reducing simultaneous switching | Lowers peak current | Design effort, sometimes latency |
What the Design Can Do
The logic design does not draw the power grid, but it sets the switching activity that creates the current. Two practical examples:
1. Avoid switching everything at once
Turning on a power-gated block all at once draws a large rush current that can collapse the supply for its neighbours. Power switches are therefore enabled in stages:
Staggered wake-up: four groups of power switches, one group per clock cycle

  cycle:         1       2       3       4
  group 1 :      ON      ON      ON      ON
  group 2 :      off     ON      ON      ON
  group 3 :      off     off     ON      ON
  group 4 :      off     off     off     ON

  powering down turns all groups off at once;
  powering up adds one more group each cycle, so the rush current is spread out
A small sequencer (in effect a shift register) enables the groups in turn. In real designs the power-switch cells are often daisy-chained in the layout so that each group turns on after the group before it, and the power intent file describes the switches. The principle is the same: limit the peak current.
2. Provide realistic activity for analysis
Dynamic IR drop analysis needs to know which cells switch together. The best source is simulation of real workloads: the simulator records which signals toggle and when (a value-change dump), and the power and IR-drop tools read that activity.
Where Does Activity-Driven Analysis Pay Off?
Worst-case IR drop often occurs in specific scenarios: a burst of vector instructions, a memory test that toggles every bit, or a power domain waking up. Teams capture activity from these high-stress workloads and run vector-based dynamic IR analysis on them, because an average-activity estimate can miss the real peaks.
Common Mistakes
Mistake #1: Checking only static IR drop
Average current can look fine while short bursts of simultaneous switching cause deep local dips. Dynamic analysis, with realistic activity and decap modelled, is needed to catch them.
Mistake #2: Forgetting the ground network
Return current raises the local ground just as supply current lowers the local VDD. The cell sees the difference between the two, so both networks must be analysed.
Mistake #3: Timing sign-off at nominal voltage only
A path that passes at the nominal supply can fail with the voltage that actually reaches its cells. Voltage-aware timing, or a margin for IR drop in the timing corners, is required.
Mistake #4: Waking a large power-gated block in one step
Switching all power switches at once draws a rush current that can drop the supply for neighbouring blocks that are already running. Stage the switch enables and let the voltage settle before releasing reset.
Practice Exercise
Challenge: Budget a Block's IR Drop
A block draws 400 mA. Its VDD path from the pad has 0.1 ohm of resistance, and its ground return path has 0.05 ohm. VDD is 0.8 V, Vth is 0.3 V, and the IR drop budget is 5% of VDD.
- What is the total IR drop, and does it meet the budget?
- A second VDD strap is added in parallel with the first, and the ground path is unchanged. What is the new drop?
- Estimate the slowdown of the block's gates before and after the fix, using overdrive.
Hint
Two equal resistances in parallel give half the resistance. Slowdown is roughly proportional to the loss of overdrive.
Solution
1. VDD drop = 0.4 x 0.1  = 40 mV
   GND rise = 0.4 x 0.05 = 20 mV
   Total    = 60 mV = 7.5% of 0.8 V   -> exceeds the 5% (40 mV) budget

2. VDD path = 0.05 ohm -> 20 mV; GND still 20 mV
   Total    = 40 mV = 5.0%             -> just meets the budget

3. Nominal overdrive = 0.5 V
   Before: 0.5 - 0.060 = 0.44 V -> ~12% less -> ~12% slower
   After:  0.5 - 0.040 = 0.46 V -> ~8% less  -> ~8% slower
Summary
In this tutorial, you learned:
- Current through the resistive power grid lowers the local VDD and raises the local ground (IR drop and ground bounce)
- Cells far from the pads, or in busy regions, see the lowest effective supply
- Static IR drop uses average current; dynamic IR drop captures short, local switching spikes
- Lower supply means less overdrive, so delay rises by a larger percentage than the voltage falls
- Denser power grids, more bumps, decap cells, and spreading activity reduce IR drop
- The design influences IR drop through switching activity, such as staging power-switch enables and providing realistic activity for analysis
