
System performance modeling predicts how fast an SoC will run its workloads before the chip exists, so that architects can choose between designs while changes are still cheap. A model might answer whether a second memory channel is needed, whether the display will ever starve, or how much a bigger system cache helps. This article explains the kinds of models, from a spreadsheet to a cycle-accurate simulator, how to build a simple one, how to check it against a more detailed simulation, and how to use the results without trusting them more than they deserve.
12 min read | Intermediate
What You'll Learn
- Explain why performance is modelled before the RTL exists
- Compare analytical, transaction-level and cycle-accurate models
- Build a simple latency model and check it against simulation
- Use model results to make and defend architecture decisions
Why Model Performance
An SoC's performance depends on how its parts interact: the processors, the interconnect, the memory controller, the DMA engines and the accelerators all compete for shared paths. These interactions are hard to reason about in one's head. By the time the RTL is written and can be simulated, most of the architecture is fixed, and changing the number of memory channels or the size of a cache costs months. A model lets the architect try such changes in hours.
Modeling also turns requirements into numbers. From Use Cases to Requirements described how use cases such as "play 4K video while recording" become performance targets. A model shows whether a proposed design meets each one, and by how much margin. When a design review asks "why two memory channels and not one", the answer is a model result, not an opinion.
Kinds of Models
Models trade accuracy for speed and effort. Performance Modeling in the Computer Architecture tutorial covers models of a processor; at the system level, the common kinds are:
- Spreadsheet and analytical models: equations for bandwidth, latency and utilization, such as the bandwidth budget in Memory Bandwidth Budgets or Little's law in Outstanding Transactions and Bursts. Built in a day, run instantly, but they average away contention and bursts.
- Queueing and statistical simulations: traffic generated with chosen rates and patterns, flowing through simple models of arbiters and queues. They show waiting times and their spread, like the arbitration results in Arbitration and Quality of Service.
- Transaction-level models: each block is a software model that exchanges whole transactions with the others, with approximate timing. They run fast enough to boot an operating system, so they can run real software, and the same models serve as a virtual platform for software teams.
- Cycle-accurate models and RTL simulation: every cycle modelled exactly. Accurate, but slow and available late.
A project uses several, moving from coarse to detailed as the design firms up. Early on, analytical models choose between broad options. Later, detailed models check the chosen design against real workloads.
Building a Simple Latency Model
A worked example shows the method. Take a small SoC with one processor core, a tightly coupled memory that answers in 1 cycle, an SRAM on the system bus that answers in 4 cycles, and peripherals on a slower bus that answer in 6 cycles. These are the latencies of that particular design. The model assumes each access to a target makes the core wait for that target's latency minus one cycle, since one cycle is needed in any case:
wait cycles = sum over targets of (accesses to target) x (latency - 1)
Counting the accesses that each test program makes to each target, and applying the formula, predicts the total time the core spends waiting for the bus. The prediction can then be compared with a cycle-by-cycle simulation of the RTL running the same programs.
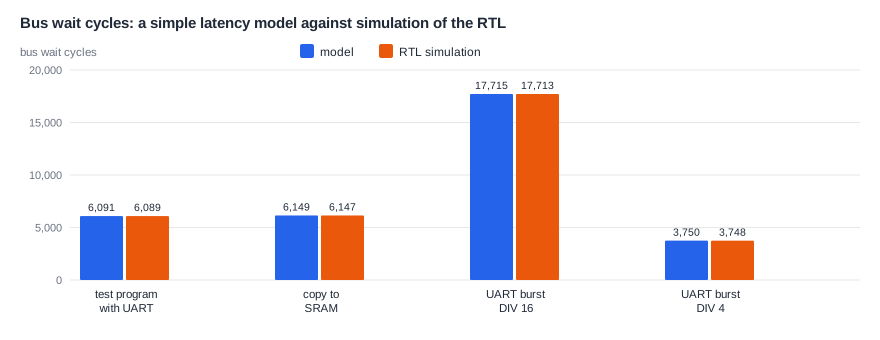
For four programs, the model is within 2 cycles of the simulation, out of thousands. A program that prints a message waits about 6,090 cycles; a long burst of UART output at a slow baud rate setting waits about 17,700. So simple a model fits so well because this small SoC has a single core with one access at a time and no contention: each access really does cost a fixed latency. The remaining difference is the same 2 cycles in every run, a fixed offset rather than an error that grows with the work.
Quick Check
Q: A program makes 1,000 accesses to the SRAM (latency 4) and 200 to a peripheral (latency 6). How many wait cycles does the model predict?
Show Answer
1,000 x (4 - 1) + 200 x (6 - 1) = 3,000 + 1,000 = 4,000 wait cycles.
When Simple Models Break
The same formula would fail on a large SoC. With several managers sharing a target, each access may wait for others, and the waiting depends on the traffic, as the arbitration results showed. With caches, most accesses never reach the bus, and the hit rate depends on the program. With a processor that keeps many accesses outstanding, latency overlaps with other work, so wait cycles no longer add up directly. A DRAM controller's latency depends on row hits and the order of requests, as Memory Controllers and Scheduling showed.
Each effect needs a richer model: queues for contention, a cache model or a measured hit rate, a model of outstanding requests, a DRAM model. The art is to add only the effects that matter for the question. A model for sizing the display's buffer needs the worst-case memory latency under load, not the processor's branch predictor.
Quick Check
Q: Why would the simple latency model fail if the processor had a cache in front of the SRAM?
Show Answer
Most accesses would hit the cache and never reach the bus, so counting every load and store at the SRAM's latency would greatly overestimate the waiting. The model would need a hit rate, measured or modelled, and the latency of a miss.
Workloads for the Model
A model is only as good as the traffic it is fed. Sources include:
- Traces recorded from a previous chip or a simulator, listing every memory access with its time.
- Synthetic traffic: generators with set rates, sizes and patterns, such as a camera writing a frame every 33 ms.
- Real software on a transaction-level model, which is the most realistic but needs software to exist.
Every source has weaknesses. Traces from an older chip reflect its own timing: on a faster design, the same program would issue its accesses sooner. Synthetic traffic misses the bursts and correlations of real programs. Good practice uses several sources and checks that the conclusions agree. If they don't, the disagreement itself shows which feature of the traffic the decision depends on.
Where Is This Used?
Phone chip teams model use cases such as camera recording with the display on and the processors busy, to size the memory system and set arbitration priorities long before RTL exists. Server processor teams run traces of database and web workloads through models of the cores, caches and interconnect to choose cache sizes and the number of memory channels. Software teams use transaction-level models as virtual platforms, so that drivers are ready on the day the first chip arrives.
Correlating the Model
A model's results matter only if it is close to the real design. Correlation compares the model with a more detailed one, RTL simulation, or a previous chip, on the same workload, and explains or fixes every difference. The latency model above was correlated against RTL simulation, and the difference was understood before the model was trusted. On a large project, correlation is continuous: as the RTL matures, the performance team runs the same tests on both and tracks the gap.
Correlation also catches bugs in the RTL. If the model predicts 100 cycles and the RTL takes 300, either the model missed something or the RTL has a performance bug, such as an arbiter that wastes a cycle on each grant or a buffer that is smaller than the spec said. Both are worth knowing. Performance bugs don't make a functional test fail, so without a model they often reach silicon.
Using the Results
Model results are estimates, and should be presented with their assumptions and their accuracy. A good habit is to give each result with the margin it has: "the display needs 1.5 GB/s and the model gives it at least 2.1 GB/s in the worst use case, so there is 40 percent margin". Small margins call for a more detailed model or a design change, large margins for none.
Sensitivity matters as much as the result. If doubling the DRAM latency barely changes the frame rate, the design is robust; if a 10 percent change in traffic makes the display starve, it is fragile, and the assumption about traffic must be checked carefully. Changing one input at a time and watching the output shows which assumptions matter most. Those are the ones to measure, or to confirm with the teams that own them, before the decision is made.
Modelling Power Alongside Performance
The same models can estimate energy. If each transaction, cache access or DRAM row opening is given an energy cost, the model adds them up as the workload runs, and adds a leakage term for the time each block is on. The result shows which use cases drain the battery and which blocks spend the energy. It also shows trade-offs that performance alone hides: a larger system cache may barely change speed, yet save a lot of energy by avoiding DRAM accesses, which cost far more per byte than on-chip ones.
Energy estimates from early models are rough, since the costs per event come from earlier chips or from estimates of the new process. They are good enough to compare options, and they are refined as the RTL and the layout give better numbers.
Keeping the Model Alive
A model built once and then forgotten soon describes a different chip from the one being designed. Teams treat the performance model as a deliverable with an owner: when the spec changes, the model changes too, and its results are rerun. A set of standard workloads is run on every new version, and the results are kept, so that a change that makes a use case slower shows up at once. After silicon arrives, the model is correlated against measurements and becomes the starting point for the next chip, which is where its largest value often lies.
Common Mistakes
Mistake #1: Trusting a model that was never correlated
A model that hasn't been compared with a more detailed one, or with real hardware, can be wrong by any amount. Correlate it and explain the differences.
Mistake #2: Modelling averages instead of the worst case
Many requirements, such as the display never starving, depend on the worst case. A model that only gives averages hides the bursts that break them.
Mistake #3: Adding detail that doesn't affect the question
A model that includes everything is slow and late. Model only what changes the answer to the decision at hand.
Practice Exercise
Challenge: Is the Model Good Enough?
A latency model predicts 12,000 wait cycles for a program. RTL simulation measures 15,600. The program also makes 1,200 accesses to the SRAM while a DMA engine is copying data to it. These numbers are assumptions for this exercise. (a) What is the model's error? (b) Suggest a likely cause. (c) How would you improve the model?
Hint
The simple model assumes the core is the only manager. What does the DMA engine add?
Solution
(a) The model is 3,600 cycles low, 23 percent under the measurement. (b) The DMA engine competes for the SRAM, so some core accesses wait for DMA transfers: 3,600 extra cycles over 1,200 accesses is 3 cycles each. (c) Add the DMA traffic and an arbitration wait for the SRAM, for example from a queueing model or from measured waits, then correlate again.
Summary
- Performance models predict an SoC's speed before RTL exists, while architecture changes are cheap.
- Analytical models are quick, queueing and transaction-level models capture contention and real software, and cycle-accurate models are exact but late.
- A simple latency model of a small single-core SoC came within 2 cycles of RTL simulation, because it had no contention.
- Contention, caches, outstanding transactions and DRAM behaviour need richer models; add only what matters.
- Correlate models with detailed simulation, report results with margin and sensitivity, and use the gaps to find performance bugs.
