
Compiler optimization levels are the settings, such as -O0, -O2 and -Os, that tell a compiler how hard to work on a program and what to favor. One option on the command line can make the same C file run several times faster, or make it much smaller, so choosing a level is one of the cheapest performance decisions a project ever makes. This article explains what each level trades, what the levels buy on two small programs, how loop unrolling and inlining work step by step, why some code breaks only when it is optimized, and how to choose.
15 min read | Beginner
What You'll Learn
- Choose between the optimization levels -O0, -O1, -O2, -O3 and -Os by what each one trades
- Explain how loop unrolling and inlining change speed and code size
- Recognize code that relies on undefined behavior and can change when it is optimized
- State the compiler and options behind any performance number
What Optimizing Trades
What a Compiler Does showed the rule every optimizer follows: the program's result must stay exactly the same, and only its cost may change. But "cost" is not one thing. Four different costs pull against each other:
- Run time: how long the program takes. This is usually the reason to optimize at all.
- Code size: how many bytes of instructions the program needs. On a small embedded chip, the program must fit in a fixed amount of flash memory, so a build that is too large cannot ship at any speed.
- Compile time: how long the build takes. Expensive optimizations can slow down a large project noticeably, and engineers rebuild many times a day.
- Debuggability: how easily a person can follow the program in a debugger. Optimized code no longer follows the C line by line, and a variable may not exist at all at the moment you want to look at it.
Energy matters too, but it mostly follows run time: a program that finishes sooner lets the processor go back to sleep sooner. No single setting wins on all four costs, which is why compilers offer a choice.
The Optimization Levels
GCC, a widely used compiler, takes the level as an option on the command line. Clang, the other major C compiler, accepts the same names:
-O0: no optimization. Each C statement is translated on its own and every variable lives in memory. Slow, but easy to follow in a debugger. This is the default if you give no option.-Og: light optimization that keeps debugging practical. It is a useful everyday choice while developing.-O1: the basic optimizations, chosen to be quick to compile: register allocation, constant folding, dead code elimination and the simpler loop optimizations.-O2: everything in-O1plus more expensive passes, including instruction scheduling and inlining of small functions. It avoids changes that make code much larger. This is the usual level for production software.-O3: everything in-O2plus optimizations that may make the code much larger in return for speed, such as aggressive loop unrolling and vectorization, which uses instructions that work on several values at once.-Os: optimize for size: most of-O2, minus anything that makes the code larger.
A level is not a single switch. It is a bundle of many separate optimizations, each with its own option. -O2 turns on dozens of them, and -O3 adds about a dozen more. The levels are simply combinations that the compiler's authors found to work well on average, and you can add or remove individual options on top of a level: -O2 -fno-inline means "everything in -O2, except inlining".
What the Levels Buy
How much each level buys depends on the program. The chart shows one test of two small programs, a checksum and a matrix multiplication, each built three ways, with the unoptimized build counted as 100:
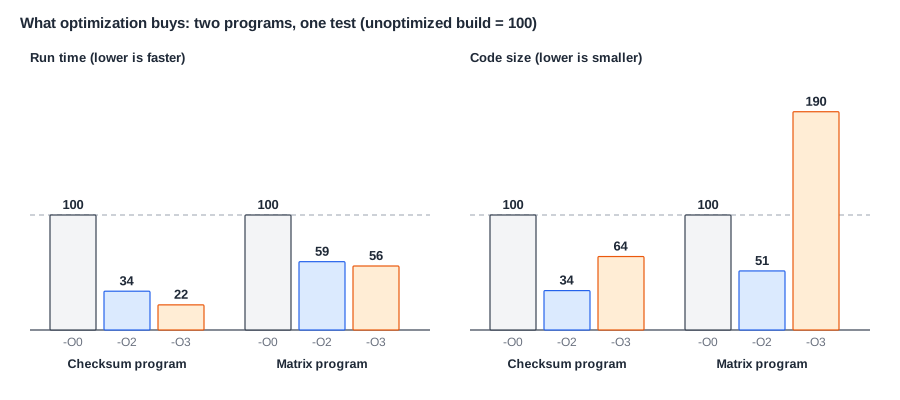
Three lessons stand out. First, turning optimization on is the big win. Across four small test programs, -O2 code ran from about one and a half to three and a half times faster than -O0 code, and took about half the space. Most of that arrives with register allocation, already at -O1. Notice that optimization made these programs both faster and smaller: unoptimized code is so wasteful that removing the waste helps every cost at once.
Second, going further is a gamble. -O3 made the checksum about a third faster than -O2 for almost twice the code. The same level made the matrix program only 6 percent faster for nearly four times the code. Neither result is a rule: a different program, or a different processor, would land somewhere else.
Third, the levels are guided by estimates that are right on average, not for every program. The checksum actually ran about 2 percent faster at -O1 than at -O2. On these small programs, -Os stayed within about 10 percent of -O2 in size and speed. It is built for larger code, and many embedded products, whose code must fit in a small flash memory, ship -Os builds.
Quick Check
Q: A team measures a new core with a benchmark built at -O0 "to keep the comparison simple". What is wrong with the numbers?
Show Answer
An -O0 build spends most of its time moving variables between registers and the stack, so it can make dozens of times as many loads as an optimized build, along with waits that optimized code does not have at all. The core is then judged on code nobody ships, and a feature that speeds up loads looks far more valuable than it is.
Loop Unrolling, Step by Step
Why did -O3 help the checksum so much? The program handles each input byte with an inner loop that runs 8 times, once per bit. At -O2 that loop keeps a counter in a4: li a4,8 before it, and addi a4,a4,-1 and bnez a4 at the end of every pass, so the branch back is taken 7 times per byte. On a simple processor, every taken branch wastes time, because the instructions it had already fetched after the branch must be thrown away.
At -O3 GCC unrolls the bit loop completely: it writes the 8 bit steps one after another and drops the counter.
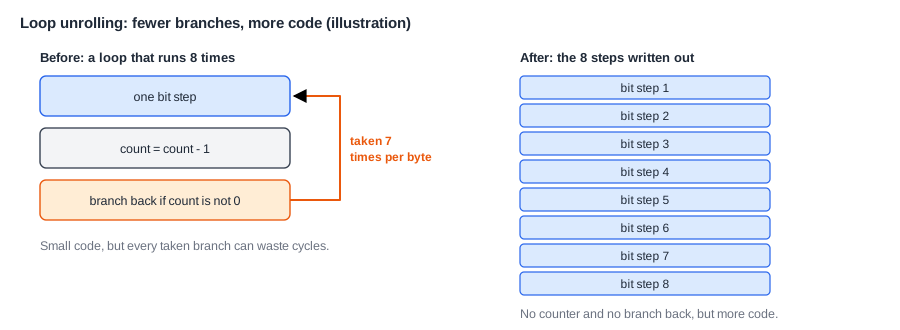
The processor now runs about a quarter fewer instructions and takes less than a quarter as many branches, which is where the extra speed comes from. The price is code that is almost twice as large. Unrolling is worth most on a processor that pays for every taken branch, and least on one with a good branch predictor, a circuit that guesses where a branch will go before it is decided. The compiler cannot know which kind will run the code unless it is told, which is what the option -mtune, described below, is for.
Unrolling also has a limit that the example does not show. Larger code takes more room in the instruction cache, the small fast memory that holds recently used instructions. If a loop grows too large to fit, the processor spends time fetching instructions from slower memory, and the "faster" build can end up slower. This is one reason -O3 is not automatically better.
Inlining
Inlining copies the body of a small function into its caller instead of calling it. Take a small random number generator, xs32: three shifts and three exclusive-ORs on a seed. It is declared static inline, and at -O2 GCC copies its body into main at both places where it is used: there is no xs32 function in the program at all. To see what that is worth, the same file can be compiled with -O2 -fno-inline, which forbids inlining. Now xs32 is a real function of 10 instructions, and main calls it with the address of the seed:
00000018: 18: lw a3,0(a0) # load the seed through the pointer 1c: mv a4,a0 20: slli a5,a3,0xd # x ^= x << 13 ... 38: sw a0,0(a4) # store the new seed 3c: ret ... 94: addi a0,sp,12 # in main: a0 = address of seed (on the stack) 98: auipc ra,0x0 9c: jalr -128(ra) # call xs32
Not inlining costs more than the call and return instructions. Because main passes the address of seed, the seed must now live in memory, on the stack at 12(sp), instead of in a register, and every call loads it and stores it back.
In one test, the build without inlining made more than twice as many jumps and about 40 percent more stores, and the program ran about 5 percent slower overall. Inlining removed all of that, and also let the optimizer schedule the generator's instructions together with the surrounding code. Its cost is code size when a large function is copied to many places, which is why compilers inline small functions freely and large ones rarely.
Why Some Code Breaks When Optimized
Sometimes a program works at -O0 and fails at -O2. The first suspicion is a compiler bug, but the usual cause is the program itself. The C language leaves some operations undefined, which means the standard makes no promise at all about what happens. Reading outside an array, using an uninitialized variable and overflowing a signed integer are all undefined behavior. The optimizer is allowed to assume they never happen, and it uses that assumption to simplify code.
Here is a small function that looks like a check for overflow:
int always(int x)
{
    return x + 1 > x;
}
On a 32-bit machine, adding 1 to the largest int would wrap around to a negative number, so a programmer might expect this function to return 0 in that one case. But signed overflow is undefined, so GCC may assume it never happens, and then x + 1 is always greater than x. At -O2 the whole function compiles to this:
always:
    li   a0,1      # return 1, whatever x is
    ret
The check has vanished. Nothing is wrong with the compiler: it kept the meaning of every program that follows the language rules. GCC's option -fwrapv tells it that signed numbers wrap around, and with that option it generates a real comparison. Higher levels make more use of such assumptions, so a hidden bug can seem to appear when the level changes. Tools such as the compiler's sanitizers, which add run-time checks with an option like -fsanitize=undefined, find these bugs directly.
Firmware has a related trap. A compiler may remove a repeated read of a device register, because it sees no code changing that memory. Such variables must be declared volatile, as Memory-Mapped I/O shows with compiled code.
Quick Check
Q: A loop reads past the end of an array by one element. The program seems to work at -O0 and crashes at -O2. Is this a compiler bug?
Show Answer
Almost certainly not. Reading outside an array is undefined behavior, so the program was already wrong; at -O0 it was just lucky about what sat next to the array in memory. Optimization changed the layout or the assumptions, and the bug became visible. Fix the loop rather than lowering the level.
Options Beyond the Levels
A few other options often matter as much as the level:
-marchsays which instructions the compiler may use. Giving it the real instruction set of the target lets it use faster instructions, such as a hardware multiply, as What an ISA Defines explains.-mtunesays which processor to tune for, without changing which instructions are allowed. The code still runs anywhere, but it is ordered and shaped for the timing of one design.- Link-time optimization (
-flto) lets the optimizer work across files. Normally each C file is compiled alone, so a function in one file cannot be inlined into another. With this option, the final step sees the whole program. - Profile-guided optimization uses a measurement of the real program. It is a two-step build: first a build that records which branches are taken and which functions run most, then a second build that uses those records instead of estimates. Large programs such as browsers and databases gain noticeably from it.
Choosing a Level
There is no best level, only a best level for a product. A reasonable way to decide starts with the question of what limits the product:
- While developing and debugging, use
-Ogor-O0, and keep at least one regular test run on the build you will ship. - For most software, ship
-O2. It gives most of the gain with little risk of large code. - When code must fit in a small memory, try
-Os, and measure whether the speed is still enough. - Try
-O3on code that spends its time in loops, and keep it only if a measurement on the real program shows a gain worth the size.
The level does not have to be the same for a whole program. A common embedded pattern builds nearly everything with -Os and only the few files that hold the time-critical loops with -O2 or -O3. The practice exercise below shows why that can work so well: a program usually spends most of its time in a small part of its code.
Where Does This Matter?
Every benchmark result names its compiler and options, because a performance number means nothing without them. One command-line flag can change a program's run time by more than a factor of four on the same processor, so comparing two processors with code built in different ways compares the builds, not the processors. When architects evaluate a design, they fix the compiler version and options first, and they measure the options the real product will use.
Common Mistakes
Mistake #1: Expecting a higher level to be faster for every program
-O3 made one program about a third faster and another only 6 percent faster, at nearly four times the code size, and -O1 can even beat -O2. Measure the levels on the real workload before choosing one, and include code size in the decision when memory is small.
Mistake #2: Blaming the optimizer for a bug in the code
A program that fails only when optimized usually depends on undefined behavior or a missing volatile. Lowering the level hides the bug without fixing it, and it can return with the next compiler version. Run the sanitizers and fix the code.
Mistake #3: Testing one build and shipping another
Code built at -O0 and at -O2 are different programs with different timing and different memory use. Debug with whichever build is convenient, but run the full tests on the exact build that ships.
Practice Exercise
Challenge: Pick a Build That Fits
A product has 64 KB of flash. These numbers are assumptions for this example. Its firmware is 58 KB at -O2, 75 KB at -O3 and 50 KB at -Os. At -O2, one signal-processing file takes 40 percent of the run time. -O3 makes that file 30 percent faster, and adds 3 KB if only that file is built with it. -Os makes the whole program 10 percent slower than -O2. (a) Which whole-program builds fit? (b) How much of the run time would -O3 save on that one file? (c) Which build would you ship?
Hint
Call the -O2 run time 1. Only the 0.4 spent in the signal-processing file changes.
Solution
(a) -O2 (58 KB) and -Os (50 KB) fit; -O3 (75 KB) does not. (b) New run time = 0.6 + 0.4 x 0.7 = 0.88, which saves 12 percent. (c) -O2 everywhere, with -O3 on that one file: 58 + 3 = 61 KB fits in 64 KB and runs 12 percent faster than plain -O2. The speed comes from a small part of the code, so the size cost stays small. Test that exact build on the real hardware before relying on the numbers.
Summary
- Optimization keeps a program's result and trades run time, code size, compile time and debuggability against each other.
- Each level is a bundle of separate optimizations:
-O0none,-O2the usual choice for production,-O3more speed at a possible size cost,-Ossmallest code. - Turning optimization on is the big win; in one test,
-O2ran about one and a half to three and a half times faster than-O0in about half the space, while the gain from-O3varied widely. - Unrolling removes branches and inlining removes calls, and both can cost code size.
- Code that fails only when optimized usually has undefined behavior; every performance number must state its compiler and options.
