
If a five-stage pipeline is good, is a thirty-stage pipeline better? More stages mean less logic per stage and so a faster clock, but each extra stage also makes wrong branches and waiting more expensive, and it adds its own register overhead. There is a best depth, and it depends on the design's goals. This article builds a simple model of that trade-off, explains what real processors chose and why the industry's race for clock frequency ended, and shows how power changes the answer.
12 min read | Intermediate
What You'll Learn
- Explain why adding stages raises frequency with diminishing returns
- Explain why adding stages raises CPI
- Use a simple model to estimate the best pipeline depth
- Describe how power limits frequency and pipeline depth
What More Stages Buy
A pipeline stage holds a slice of the processor's total work. If the total logic delay is L, and there are n stages, each stage has L / n of logic if they are balanced. Each stage also needs a pipeline register, and that adds a fixed overhead R: the clock-to-Q delay, the setup time, and a margin for variation in the clock. Clocks, Cycles and Time explains those terms. So the clock period is:
period = L / n + R
The first term shrinks as stages are added; the second does not. With an assumed L of 10 ns and R of 0.25 ns, going from 1 stage to 5 takes the period from 10.25 ns to 2.25 ns, about 4.6 times the frequency. Going to 10 stages gives about 8.2 times. Going to 40 gives about 20 times, half of the ideal 40. At 40 stages, the register overhead is as large as the logic in each stage. There is a hard limit: as n grows without end, the period approaches R, and the frequency can never exceed 1 / R.
That is the first diminishing return. Real designs reach it sooner, because the work does not divide evenly. Some paths cannot be split sensibly: an ALU and its forwarding loop must finish in one cycle if dependent instructions are to run back to back, and a register file read cannot be cut at any point you like.
What More Stages Cost
Every extra stage makes some hazards worse. In a five-stage pipeline, a branch resolved in the third stage flushes two instructions. In a pipeline that resolves branches in stage 15, a wrong guess throws away 14 cycles' worth of work. And if the pipeline is wide, that is several instructions per cycle.
The same applies to data. If the ALU takes two stages instead of one, then two dependent additions can no longer run back to back, and a one-cycle gap appears in the most common pattern in programs. Loads take more stages, so the load-use penalty grows. Filling the pipeline after a flush, handling exceptions, and waiting for memory all take more cycles too.
So CPI rises roughly in a straight line with depth. If each extra stage adds c lost cycles per instruction on average, then:
CPI = 1 + c x (n - 1)
Quick Check
Q: A processor mispredicts one branch in every 50 instructions, and the penalty equals its pipeline depth of 20 cycles. How much CPI do branches add? What if the depth is 10?
Show Answer
At depth 20: 20 / 50 = 0.4 cycles per instruction. At depth 10: 0.2. Halving the depth halves this cost, which is one reason branch prediction accuracy matters more the deeper the pipeline is.
The Best Depth: A Simple Model
Performance is one divided by the time per instruction, and the time per instruction is CPI times the period. Combine the two formulas above:
time per instruction = (1 + c x (n - 1)) x (L / n + R)
Here is that model with L = 10 ns, R = 0.25 ns and c = 0.12 lost cycles per instruction per stage. These are assumptions to show the shape of the trade-off; they do not describe any particular chip:
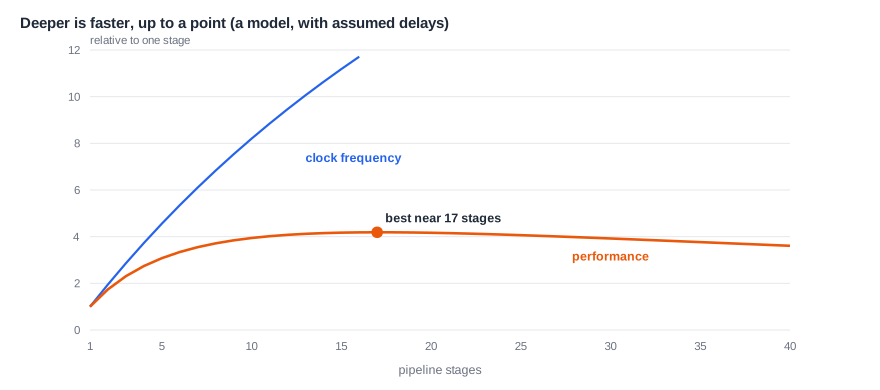
Frequency keeps climbing, but performance rises steeply, flattens, peaks at about four times the single-stage design near 17 stages, and then falls. The peak is broad: anything from about 12 to 25 stages gives nearly the same result. Five stages already give about three quarters of the best performance, at much lower cost and complexity.
The model is simple enough to solve by hand. The best depth is close to:
best n = square root of ( L / (R x c) )
With the values above, that is the square root of 10 / (0.25 x 0.12), about 18. The formula tells you what moves the answer. Better branch prediction lowers c, so the best pipeline gets deeper. Better flip-flops lower R, with the same effect. A design with a lot of logic per instruction, a larger L, also favors more stages.
Measuring Depth in Gate Delays
Comparing pipelines across manufacturing processes is hard, because a transistor in a new process is much faster than one in an old process. Designers therefore describe a stage by how much logic it holds, rather than by how many nanoseconds it takes. The usual unit is the FO4 delay: the delay of one inverter driving four copies of itself. It scales with the process, so a design described in FO4 can be compared with a design from ten years earlier.
Studies of this question around 2002 found that, counting performance alone, the best stage holds only about 6 to 8 FO4 of logic, plus about 2 to 3 FO4 of latch or flip-flop overhead: roughly 8 to 11 FO4 per stage in total. Going further leaves too little room for useful logic, because the fixed overhead becomes a large share of every cycle. That is the same limit as the 1 / R term in the model, stated in a unit that survives from one process to the next. Real designs put more logic than this in each stage, for the power reasons explained below.
Balancing the Stages
The formula assumes the logic divides evenly, and in a real design that takes work. The clock must fit the slowest stage, so a pipeline with one long stage gets no benefit from the short ones. Engineers shift logic across a pipeline register, a technique called retiming, and synthesis tools can do some of it automatically. They also split the worst stage in two, which adds a cycle of latency for that step only, or they move a slow operation, such as a memory lookup, into its own stage. When a timing report shows that one stage is far worse than the others, that stage decides the whole chip's frequency, and improving any other stage gains nothing.
What Real Processors Did
In the 1990s and early 2000s, clock frequency sold computers, and designers pushed pipelines deeper. Intel's Pentium 4 used a pipeline of about 20 stages, and its later Prescott version about 31, aiming for clock frequencies far above its competitors. Intel had even planned successors with 40 to 50 stages. It got the frequency, but its branch penalty was very large, and a later generation's power problems were so severe that a planned faster version was canceled.
Intel's own response is the most instructive part of the story. It cancelled those deeper designs, and its next family, the Core microarchitecture of 2006, went back to a pipeline of about 14 stages at a lower clock, and beat the deep design at much lower power. Most large modern cores now use somewhere around 10 to 20 stages. Small embedded cores use from 2 to 8.
Power Changes the Answer
The model above ignores power, and that is what ended the frequency race. Dynamic power is proportional to voltage squared times frequency, and reaching a higher frequency usually needs a higher voltage, so power rises much faster than speed. PPA Trade-offs and Amdahl's Law explains this.
A deep pipeline adds to the problem in two more ways. The pipeline registers themselves burn power, since they switch every cycle, so a design with twice the stages has many more flip-flops. And every instruction thrown away after a wrong branch wasted the energy spent on it. When power became the limit, around 2005, studies that counted energy as well as speed found that the best pipeline was noticeably shallower than the best for performance alone, and the more power mattered, the shorter it became.
Since then, performance has come mainly from doing more per cycle rather than from more cycles per second: wider cores, better prediction, larger caches, and more cores on a chip. The clock frequency of the fastest desktop chips has risen only slowly in twenty years.
Where Does This Matter?
Choosing a pipeline depth is one of the first decisions on a new core, because it shapes everything else. An embedded core for a 100 MHz microcontroller gains nothing from deep pipelining: its memories can already keep up, so three stages may be ideal. A phone core must hit a high frequency at low voltage and needs a much deeper design. And flash memory is often the true limit on small chips, so designers add wait states or caches rather than stages.
Other Ways to Get Depth Without the Cost
Designers have found ways to keep some of the frequency without the full penalty. Good branch predictors reduce how often the long flush is paid. Forwarding keeps dependent arithmetic back to back. Fast paths such as micro-op caches, which store already decoded instructions, let a resolved branch skip the early stages and restart closer to execution. Some designs run simple ALUs at full speed on a short path while longer operations take several stages.
Physical design matters as well. On a large chip, signals may need a whole cycle just to cross a block, so some pipeline stages exist only to move data along wires. These stages add depth without any computing. A design's depth is therefore partly a result of the chip's floorplan.
Quick Check
Q: A team halves its branch misprediction rate, which halves c in the model. By how much does the best pipeline depth change?
Show Answer
The best depth follows the square root of 1 / c, so it rises by the square root of 2, about 1.4 times. A best depth of 18 would become about 25. In practice the team could also stay at the same depth and keep the gain as higher performance.
Common Mistakes
Mistake #1: Assuming frequency grows in proportion to stages
The register overhead does not shrink. Doubling the stages at a depth where the overhead is already significant gives much less than double the frequency.
Mistake #2: Counting only the branch penalty
Depth also costs more load-use cycles, longer multi-cycle operations, more flip-flop power and a harder verification job. A model with only branch cost favors pipelines that are too deep.
Mistake #3: Trusting a single model
A simple formula shows the direction of a trade-off, but its answer depends entirely on the assumed values. Use it to understand what matters, then measure with real designs and real workloads.
Practice Exercise
Challenge: Three Depths
Use the model with L = 10 ns, R = 0.25 ns and c = 0.12. (a) Calculate the period, CPI and time per instruction at 5, 15 and 30 stages. (b) Which is fastest? (c) How much speed is lost by choosing 10 percent fewer stages than the best? Why does this suggest choosing the shallower option?
Hint
Period = 10 / n + 0.25. CPI = 1 + 0.12 x (n - 1). Multiply them.
Solution
(a) n = 5: period 2.25 ns, CPI 1.48, time 3.33 ns. n = 15: period 0.917 ns, CPI 2.68, time 2.46 ns. n = 30: period 0.583 ns, CPI 4.48, time 2.61 ns. (b) n = 15. (c) The curve is very flat around the peak, so the loss is a fraction of a percent, while fewer stages save flip-flops, power and design effort. A design just short of the peak usually beats one at the peak once power and cost are counted.
Summary
- The clock period is L / n + R, so frequency gains shrink as the register overhead takes over.
- Each stage adds lost cycles, so CPI rises about in a straight line with depth.
- Performance peaks at a depth near the square root of L / (R x c), and the peak is broad.
- Power ended the frequency race: flip-flops and wasted instructions both cost energy.
- Modern large cores use about 10 to 20 stages, and small cores from 2 to 8.
