
A workload is the set of programs a computer is expected to run, and a benchmark is a program chosen to stand in for that workload when measuring performance. Since a processor's speed depends on the program, every performance number is really a statement about a workload. Choosing the wrong programs can make a good design look bad or the reverse, and companies have spent years of engineering on features that only helped a benchmark. This article explains why programs behave so differently, what makes a good benchmark, how the well-known industry suites work, and how to report and average results honestly.
13 min read | Beginner
What You'll Learn
- Explain why the same processor gives different results on different programs
- Describe the common kinds of benchmark and what each one can and cannot show
- Calculate a fair average of performance ratios with the geometric mean
- Recognize a misleading benchmark claim
Why the Program Matters
The performance equation says run time is instruction count times CPI times clock period. The clock period belongs to the chip, but the other two depend on the program: how many instructions it runs, and which ones. The Performance Equation explains the formula.
Programs differ in their instruction mix, the share of each kind of instruction they execute. The picture shows six small programs:
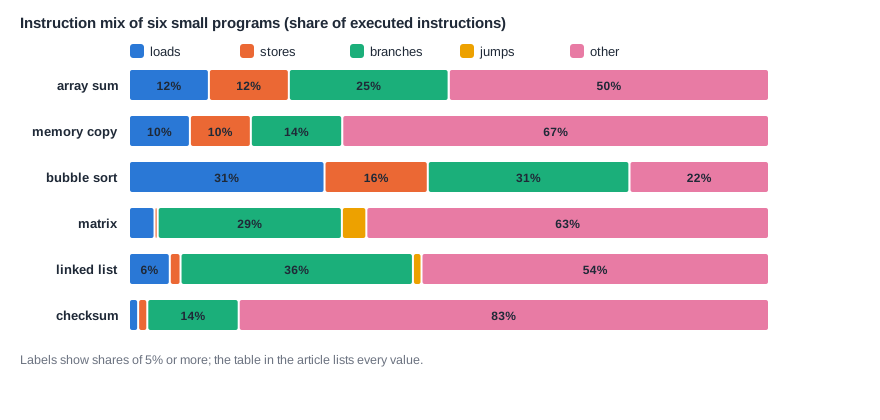
The checksum is mostly arithmetic and shifts, and it hardly touches memory: only about 3 percent of its instructions are loads and stores. The bubble sort is nearly the opposite, with almost half of its instructions moving data. The linked-list program spends more than a third of its instructions on branches. A processor with a slow memory path will hurt the sort badly and barely affect the checksum. A processor with a poor branch predictor will hurt the linked-list program and not much else.
Mix is only the start. Two programs with the same mix can behave very differently. One may walk through memory in order, which caches handle well; another may jump around, which caches handle badly. One may have branches that go the same way every time; another may have branches that depend on random data. These properties, how the program touches memory and how predictable it is, often matter more than the instruction mix.
In one test, the speedup from a single pipeline feature on these six programs ranged from about 1.17 to about 1.7. Anyone who measured only one of them would have drawn the wrong conclusion in one direction or the other. That is why one program never proves anything about a processor.
Kinds of Benchmark
The ideal benchmark is the real program the customer will run, with real data. When that is possible, nothing else is needed. Often it is not: the program may not exist yet, it may take hours, or it may belong to someone else. So engineers use stand-ins, each with its own strengths:
- Real applications are complete programs such as a compiler, a video encoder or a database. They are the most honest, but they are large, slow to simulate and hard to port to a new processor.
- Kernels are small, important pieces of real programs, such as a sort, a matrix multiplication or a checksum. They are easy to run and to understand, and useful for studying one feature. They say little about a whole system.
- Synthetic benchmarks are programs written just to imitate the statistics of real code. They are small and portable, but because they do no real work, compilers and designers can take advantage of them.
- Traces are recordings of what a real program did, such as a list of the addresses it used. They let a model of a cache or a branch predictor be tested without running the program again.
Early in a project, when only a simple model of the processor exists, architects use kernels and short samples of real applications. The further the design goes, the slower the tools become: detailed simulation of a large core can be tens of thousands of times slower than the chip, so a one-second program would take many hours. Teams therefore pick short representative slices of long programs, a technique called sampling.
Quick Check
Q: An architect tests a new cache using only a checksum kernel that keeps almost everything in registers, and sees no gain. What should they conclude?
Show Answer
Nothing about the cache. A program that rarely touches memory cannot show the benefit of a cache. The result says the benchmark does not exercise the feature, so the test must be repeated with programs that do.
Industry Benchmarks
A few benchmark suites are used across the industry, because a shared, well-defined test lets different products be compared.
Dhrystone
Dhrystone is a small synthetic benchmark from the 1980s, and results are still quoted in DMIPS, Dhrystone MIPS, often per MHz. It is tiny, runs on almost anything, and is a poor measure. Its small size means that memory hardly matters, modern compilers can remove parts of it, and it fits in any cache. It survives mainly because the numbers are easy to obtain and old datasheets used them.
CoreMark
CoreMark was created in 2009 by the Embedded Microprocessor Benchmark Consortium (EEMBC) to replace Dhrystone for small processors. It combines list processing, matrix operations, a state machine and a checksum, and it computes its results at run time so that the compiler cannot remove the work. Scores are usually given as CoreMark per MHz. It is a good, free first look at a microcontroller core, but it is still small, so it tells you about the core and little about a memory system.
SPEC CPU
SPEC CPU is the best-known suite for large processors, from the Standard Performance Evaluation Corporation. It uses real applications: compilers, compression, simulation, physics, and more, split into integer and floating-point groups. Each program runs for minutes on a fast machine and uses a lot of memory. Results are reported as a ratio to a reference machine, and submitted results must follow strict rules and publish the full details of the system and compiler options. It is licensed rather than free, and it takes real effort to run.
Application Benchmarks
Other fields have their own suites. Phones and laptops are compared with suites such as Geekbench that imitate everyday tasks. Machine learning hardware is compared with MLPerf, which measures full training and inference tasks. Servers are measured with database and web-serving workloads. The principle is the same: measure something close to what the customer will do.
Where Does This Matter?
Before a new processor is defined, the architecture team agrees on a target list: SPEC scores for a server chip, or CoreMark per MHz and power per MHz for a microcontroller. Those numbers go into the product plan and into contracts with customers. Then every proposed feature is evaluated against the same set of workloads, so that a choice made in one part of the design can be compared with a choice made in another.
Reporting and Averaging Results
Once there are results for many programs, people want one number. How to average them matters.
Suppose a new processor gives these speedups over an old one on two programs: 2.0 on program A, and 0.5 on program B. It is twice as fast on one and twice as slow on the other, so overall it should come out even. The ordinary arithmetic mean says (2.0 + 0.5) / 2 = 1.25, a 25 percent gain from nothing. Reverse the comparison, old against new, and the speedups are 0.5 and 2.0, again averaging 1.25, so each processor appears faster than the other.
The geometric mean, the n-th root of the product of n values, does not have this problem. For the example, the square root of 2.0 x 0.5 is 1.0, exactly even, and it gives the same answer whichever machine is the reference. For this reason SPEC and most other suites use the geometric mean of ratios:
geometric mean = (r1 x r2 x ... x rn) ^ (1/n)
On the other hand, if you really care about total time for a fixed job, for example a set of programs that always run together, then add up the run times and compare the totals. The geometric mean answers "how much faster in a typical program", and total time answers "how long does this exact job take". Weighted averages are useful when you know how often each program runs.
What Goes Wrong: Benchmarketing
Whenever a number decides a sale, people will try to raise the number rather than the performance. The practice has a name, benchmarketing, and it takes predictable forms.
A compiler can recognize a famous benchmark and apply a special optimization that helps nothing else. This has happened more than once. A vendor can quote a number obtained with an expensive compiler, or with special options, or with memory cooled and overclocked, none of which a customer would use. Phones have been caught detecting a benchmark app by name and raising their clock limits only for that app. A chart can use a vertical axis that does not start at zero, so a 3 percent gain looks like a doubling.
The defense is to ask the same questions every time. Which exact programs and inputs? Which compiler and which options? Which memory and cache configuration? Peak or sustained? What was it compared with? A result that does not answer these is an advertisement rather than a measurement. A good report states them all, so that someone else could repeat the result.
Quick Check
Q: On three programs, a new design gives speedups of 1.0, 1.0 and 8.0. What are the arithmetic and geometric means, and which better describes a typical program?
Show Answer
Arithmetic mean: 10 / 3 = 3.33. Geometric mean: the cube root of 8 = 2. The geometric mean is less pulled up by the one outlier, but neither tells the whole story: most programs got no gain. Reporting all three numbers is better than either average.
Choosing Workloads for Your Own Design
For a real product, start from what the chip will do. A motor controller needs its control loop measured; a network chip needs packet processing measured, with realistic packet sizes; a phone processor needs app launches, browsing and camera work. Then follow a few rules:
- Use the real compiler and options the product will ship with, as Compiler Optimization Levels explains.
- Use realistic data sizes. A cache study with data that fits in the cache shows nothing.
- Include programs that stress different parts: memory, branches, arithmetic.
- Keep some programs out of the tuning set and use them only for the final check, so that the design is not simply fitted to the benchmarks.
- Check that a small kernel behaves like the larger program it stands in for, by comparing the instruction mix, branch behavior and memory behavior.
Common Mistakes
Mistake #1: Quoting one benchmark as the speed of a processor
A processor has no single speed. It has a speed on each program. State the workload with every number, and use several programs that exercise different parts of the design.
Mistake #2: Averaging ratios with the arithmetic mean
The arithmetic mean of speedups favors whichever machine happens to be the reference. Use the geometric mean for ratios, or compare total times when a fixed job really is what matters.
Mistake #3: Using data that is too small
A small kernel with a small array fits in any cache and shows no memory cost, so a design tuned on it may fall apart on real data. Check that the benchmark's data is at least as large as the part of the design under study.
Practice Exercise
Challenge: Which Core Wins?
Two cores run three programs. These run times are assumptions for this exercise. Core P takes 10 s, 20 s and 40 s. Core Q takes 5 s, 30 s and 40 s. (a) Calculate the speedup of Q over P for each program. (b) Calculate the geometric mean of those speedups. (c) Calculate the total time on each core. (d) The customer runs the second program ten times as often as the other two. Which core should they buy?
Hint
Speedup is the time on P divided by the time on Q. For (d), weight the second program by 10 when adding up the time.
Solution
(a) 10 / 5 = 2.0, 20 / 30 = 0.667, 40 / 40 = 1.0. (b) The cube root of 2.0 x 0.667 x 1.0 = the cube root of 1.333 = 1.10, so Q looks about 10 percent faster on a typical program. (c) P takes 70 s, Q takes 75 s, so P is slightly faster on the fixed set. (d) P: 10 + 200 + 40 = 250. Q: 5 + 300 + 40 = 345. P is clearly better for this customer. The answer changed with the question, which is why the workload must be stated first.
Summary
- Programs differ in instruction mix, memory behavior and predictability, so a processor's speed depends on the workload.
- Real applications are the most honest test; kernels, synthetic benchmarks and traces are cheaper stand-ins with clear limits.
- Dhrystone is outdated, CoreMark suits small cores, and SPEC CPU is the standard for large ones.
- Average ratios with the geometric mean, and compare totals when a fixed job matters.
- A trustworthy result states the programs, inputs, compiler, options and system, so that someone else could repeat it.
