
The performance equation says that a program's run time is the number of instructions it executes, times the average number of clock cycles each instruction takes, times the length of one clock cycle. It is the most useful formula in computer architecture, because it turns the vague question "how do I make this faster?" into three separate questions, each answered by different people. This article explains each factor, shows how the compiler, the instruction set, the microarchitecture and the chip technology each move one of them, and uses a small array program to show why looking at only one factor gives the wrong answer.
13 min read | Beginner
What You'll Learn
- Write the performance equation and explain each of its three factors
- Compute run time, CPI and speedup from instruction and cycle counts
- Say which design decisions change which factor
- Avoid comparisons based on clock frequency, CPI or MIPS alone
What "Faster" Means
When a person says one computer is faster than another, they can mean two different things. Response time, also called execution time or latency, is how long one task takes from start to finish. Throughput is how much work is finished per unit of time, such as requests served per second. A faster processor usually improves both, but not always: adding a second processor core to a server lets it finish twice as many requests per second, while each single request takes just as long.
This article is about response time for one program on one processor, because that is the base on which everything else is built. The rule for this kind of performance is simple: the only reliable measure is the time the real program takes. Everything else, clock frequency included, is at best a part of the answer.
When we compare two designs, we use the word speedup: the old run time divided by the new run time. A speedup of 1.25 means the new design does the job 1.25 times as fast, so it takes 1 / 1.25 = 0.8 of the old time, 20 percent less. Notice that "25 percent faster" and "20 percent less time" describe the same change. Mixing them up is a common source of confusion.
The Equation
Run time can be split into three factors:
run time = (instructions / program) x (cycles / instruction) x (seconds / cycle)
         = instruction count x CPI x clock period
The units cancel like fractions: instructions per program, times cycles per instruction, times seconds per cycle, leaves seconds per program. Each factor has its own meaning:
- The instruction count is the number of instructions the processor actually executes while the program runs, not the number stored in the program file. A loop of four instructions that runs a thousand times counts as 4,000, as How a Program Runs explains.
- CPI, cycles per instruction, is the average number of clock cycles each executed instruction takes. Its inverse, IPC, instructions per cycle, says the same thing the other way up, and is the usual measure for processors that finish more than one instruction per cycle.
- The clock period is the length of one cycle, which is 1 / frequency. Clocks, Cycles and Time explains what sets it.
A worked example with simple numbers: a program executes 1 million instructions at a CPI of 1.5 on a 100 MHz processor. The clock period is 10 ns, so the run time is 1,000,000 x 1.5 x 10 ns = 15,000,000 ns, or 15 ms. These numbers are assumptions for this example. Doubling the clock, or reducing the CPI to 0.75, or removing half the instructions would each cut the time to 7.5 ms. To the equation they are all the same; in practice they cost very different amounts of work.
What Moves Each Factor
The value of the equation is that it shows who controls what:
| Who decides | Instruction count | CPI | Clock period |
|---|---|---|---|
| The algorithm and programmer | yes, the most | some, through memory use and branches | no |
| The compiler | yes | yes, through scheduling | no |
| The instruction set | yes | somewhat | somewhat |
| The microarchitecture | no | yes, the most | yes |
| The chip technology and layout | no | no | yes, the most |
A better algorithm can reduce the instruction count by a factor of a thousand, which no hardware can match. A compiler changes which instructions run and in what order. An instruction set with a multiply instruction replaces a library routine of dozens of instructions with one. The microarchitecture, meaning how the processor is organized inside, decides how many cycles instructions need on average, and also how much logic must fit in one cycle. The manufacturing process and the layout decide how fast each gate switches.
The factors are not independent. That is what makes processor design interesting. Splitting the work into more pipeline stages shortens the clock period but raises the CPI, because more instructions are thrown away after a wrong branch. Adding a complicated instruction lowers the instruction count but may lengthen the clock period for everything else. Almost every design decision moves two factors in opposite directions, and only the product matters.
Quick Check
Q: Design A runs a program with a CPI of 1.2 at 1 GHz. Design B needs a CPI of 1.5 for the same instructions but runs at 1.5 GHz. Which is faster, and by how much?
Show Answer
Time per instruction: A takes 1.2 x 1 ns = 1.2 ns. B takes 1.5 x 0.667 ns = 1.0 ns. B is faster, with a speedup of 1.2 / 1.0 = 1.2, despite its worse CPI.
One Program, Two Builds
Here is a real case. A small program fills an array of 1,024 numbers and adds them up. It was compiled twice from the same C file, with optimization (-O2) and without it (-O0), and both builds were run on a simple five-stage processor at 100 MHz:
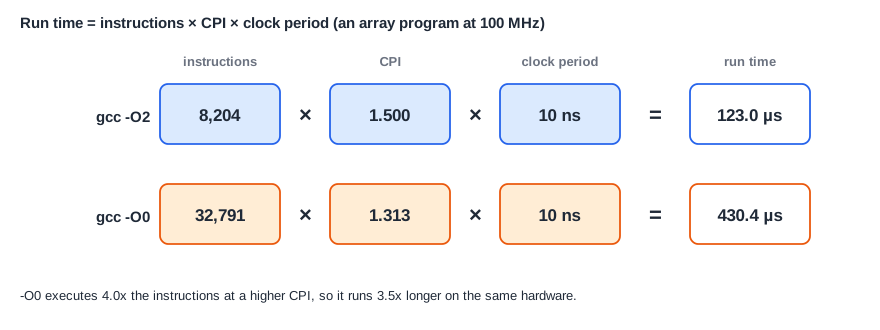
The clock period is the same in both rows, because the hardware did not change. The unoptimized build executes about four times as many instructions, because it keeps every variable in memory, as Registers and the Register File shows. So far that is what you would expect.
Now look at CPI. The unoptimized build has the better CPI, about 1.3 against 1.5, and yet it takes 3.5 times as long. Its extra instructions are mostly simple loads and stores that rarely upset the pipeline, while the tight optimized loop takes a branch every four instructions and loses cycles each time. This is the classic trap: a lower CPI can belong to a slower program, because CPI says nothing about how many instructions were needed. A processor or compiler change must always be judged by the product of the factors.
Where the Cycles Go: The CPI Stack
A CPI above 1 on a processor that can finish one instruction per cycle means cycles are being lost somewhere. Engineers split the CPI into its causes. If a program spends its time like this, the total CPI is the base of 1 plus each kind of lost cycle per instruction. The result is called a CPI stack:
CPI = 1.0                               every instruction takes one cycle
    + branch flushes per instruction    wrong instructions thrown away
    + load-use stalls per instruction   waiting for a value from memory
    + memory waits per instruction      waiting for a slow memory
Six small programs measured this way on a simple five-stage processor had a CPI between about 1.26 and 1.6. For most of them, nearly all the lost cycles were branch flushes: about a third of all cycles in the array program and in a linked-list program, and about a fifth in a checksum program. A bubble sort also lost about a tenth of its cycles to load-use stalls. The processor's memory was very fast in this test, so nothing was lost waiting for it. On a real system with slower memory, the stack would look very different.
The stack tells an architect where to work. If branch flushes make up a third of the run, then better branch handling is worth studying. If they make up 2 percent, the same idea is a waste of time. PPA Trade-offs and Amdahl's Law turns this into a rule for how much a change can possibly gain.
Where Does This Matter?
Real processors contain performance counters, hardware registers that count cycles, instructions, branch mispredictions, cache misses and other events while the program runs. Tools such as perf on Linux read them, so an engineer can measure the instruction count and CPI of real software on a real machine, and split the lost cycles into a stack. Performance teams at chip companies do this for every important application before deciding what to improve in the next design.
Why Single Numbers Mislead
The equation also explains why the popular single numbers for a processor do not tell you how fast it is.
Clock Frequency
Frequency is only one factor out of three. In the early 2000s, one well-known desktop processor family reached very high frequencies by using an unusually long pipeline, and it was often beaten by competitors at much lower frequencies that finished more instructions per cycle. Two processors at the same frequency can differ in speed by a factor of several.
CPI or IPC Alone
The array program above shows it: the slower build had the better CPI. CPI comparisons only make sense for the same instructions. Comparing the CPI of two processors with different instruction sets means little, because their instructions do different amounts of work.
MIPS
MIPS here means millions of instructions per second (not the processor family of the same name). It is frequency divided by CPI, so it ignores the instruction count entirely. The unoptimized build above reaches a higher MIPS rating than the optimized one, because it runs simple instructions with a lower CPI, even though it takes 3.5 times as long to do the same job. A rating that rewards doing the job badly is not a good rating.
Peak Numbers
Datasheets often state the best case: the highest frequency reached for a moment before the chip gets too hot, or the highest IPC on the most favorable code. A real program running for minutes on a real thermal design sees something lower.
Quick Check
Q: A compiler change reduces the instruction count by 10 percent, but raises the CPI from 1.40 to 1.50. Is the program faster?
Show Answer
Compare the products. Old: 1.00 x 1.40 = 1.40. New: 0.90 x 1.50 = 1.35. The time falls by 1.35 / 1.40 = 0.964, about 3.6 percent less time. The program is slightly faster, although its CPI got worse.
Using the Equation in Design Work
Architects use the equation to estimate a change before building anything. Suppose a five-stage processor loses 2 cycles on each taken branch, and taken branches are 15 percent of executed instructions. Branches then add 0.15 x 2 = 0.30 to the CPI. A cheap branch predictor that avoids three quarters of those lost cycles removes 0.225 from the CPI. If the CPI was 1.5, it becomes 1.275, a speedup of 1.5 / 1.275 = 1.18, as long as the clock period stays the same. These numbers are assumptions for this example, but the method is exactly what is done in practice, and it takes one minute with a calculator.
The same calculation also shows when a change is not worth making. If the predictor's logic made the clock period 20 percent longer, the time per instruction would be 1.275 x 1.2 = 1.53 compared with the original 1.5 and the design would be slower overall, despite the better CPI.
Estimates like this are only as good as the measurements behind them, which is why choosing the right programs to measure matters so much. Workloads and Benchmarks covers that.
Common Mistakes
Mistake #1: Using the stored instruction count
The instruction count in the equation is the number executed, not the number in the file. A 22-instruction program can execute thousands of instructions. Run the program or count the loops; do not read the size of the file.
Mistake #2: Treating CPI as a property of the processor
CPI depends on the program as well as the processor. The same core gave a CPI from about 1.26 to about 1.6 on six small programs, and the number moves further with slower memory. Always say which program a CPI belongs to.
Mistake #3: Optimizing one factor and ignoring the others
A higher clock frequency that adds pipeline stages, or a lower instruction count from a new instruction that slows the clock, can leave the run time unchanged or worse. Multiply all three factors before deciding.
Practice Exercise
Challenge: Compare Three Designs
A program executes 2 million instructions on a baseline processor with a CPI of 1.5 at 200 MHz. These numbers are assumptions for this exercise. (a) What is its run time? (b) Design X adds a hardware multiplier. Instruction count falls by 20 percent, CPI stays at 1.5, but the clock falls to 180 MHz. (c) Design Y adds a pipeline stage. The clock rises to 250 MHz, instruction count stays the same, and CPI rises to 1.7. Which design is fastest, and what is its speedup over the baseline?
Hint
Write the clock period in nanoseconds for each design: 5 ns, 5.56 ns and 4 ns. Then multiply the three factors.
Solution
(a) 2,000,000 x 1.5 x 5 ns = 15 ms. (b) 1,600,000 x 1.5 x 5.56 ns = 13.3 ms. (c) 2,000,000 x 1.7 x 4 ns = 13.6 ms. Design X is fastest, with a speedup of 15 / 13.3 = 1.13 over the baseline. It wins although it has the lowest clock frequency of the three, and design Y loses part of its faster clock to its higher CPI.
Summary
- Run time = instruction count x CPI x clock period; only the product matters.
- Algorithms and compilers mainly change the instruction count, the microarchitecture mainly changes CPI, and the technology mainly changes the clock period.
- Design decisions usually move two factors in opposite directions.
- A CPI stack splits the lost cycles by cause and shows where improvements can help.
- Clock frequency, CPI and MIPS alone can mislead: an unoptimized build had a better CPI and took 3.5 times as long.
