
How a program runs on a processor is a story of three mechanisms: loops, which make the processor execute the same few instructions thousands of times; function calls, which jump to shared code and come back; and the stack, the region of memory where each active call keeps what it must not lose. Together they decide how many instructions a program executes and how much memory it needs while running, two numbers every architect and firmware engineer must be able to predict. This article follows an array loop, a linked-list program and two small recursive functions, fib and rsum, draws a real stack frame, and shows how to predict instruction counts and stack depth from a listing.
19 min read | Beginner
What You'll Learn
- Explain the difference between static and dynamic instruction counts and predict the dynamic count of a loop
- Describe how calls and returns use the return address, and when a function must save it
- Read a stack frame from a real function prologue and explain each slot
- Predict the stack depth and instruction count of a recursive function and compare with a measurement
A Program at Run Time
The processor does not see functions, loops or variables. It holds one address, the program counter (PC), fetches the instruction at that address, executes it and moves the PC on: to the next instruction, 4 bytes further, or to a new address if the instruction was a taken branch or a jump. The Instruction Cycle describes these steps. Everything a program does at run time is a pattern in that sequence of addresses.
That gives two very different ways to count a program's instructions. The static count is the number of instructions in the program file. The dynamic count is the number the processor actually executes, which is what decides run time. A small program that fills an array and adds it up is 88 bytes of code, so its static count is 88 / 4 = 22 instructions. Its dynamic count is over 8,000, more than 370 instructions run for each one stored, because the same few instructions run over and over. The difference comes from loops.
Loops: The Same Instructions Again
That program fills an array of 1,024 numbers and then adds them up. Compiled with gcc -O2, the filling loop is four instructions:
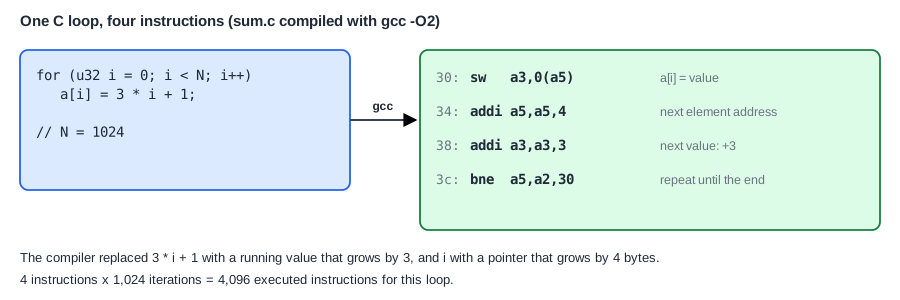
The store writes one element, the two additions advance the address and the value, and bne (branch if not equal) jumps back to the store until the pointer reaches the end of the array. At machine level every loop has this shape: a body, then a conditional branch back to its start. Branches and Jumps shows how for and while loops compile; here the question is what happens when they run.
A loop's dynamic cost is the number of instructions in its body times the number of passes. Each of its two loops has 4 instructions and runs 1,024 times. Around them is a small amount of straight-line code that runs once: 4 instructions of start-up code, 6 that set up the first loop, 1 between the loops and the final ret, 12 in all. The prediction is therefore
dynamic count = 2 loops x 4 instructions x 1,024 passes + 12 = 8,204
and a real run gives exactly that number.
The branches agree too. Each loop executes its bne once per pass, 2 x 1,024 = 2,048 times, and it is taken every time except the last, when the loop ends: 2,048 - 2 = 2,046 taken. This kind of check, predicting a number from the listing before trusting a measurement, is how architects catch broken benchmarks and broken counters.
Nested Loops Multiply
When a loop runs inside another, the counts multiply. A linked-list program walks a list of 512 nodes 8 times, and its final phase is two nested loops:
 158:  mv   a5,a6            # outer loop: start at the first node
 15c:  lw   a4,4(a5)         # inner loop: load p->val
 160:  lw   a5,0(a5)         #             load p->next
 164:  add  a0,a0,a4         #             s += val
 168:  bnez a5,15c           #             repeat while p != 0
 16c:  addi a3,a3,-1         # outer loop: one walk fewer
 170:  bnez a3,158           #             repeat 8 times
The inner body of 4 instructions runs once per node per walk, 512 x 8 = 4,096 times, so this short piece of code executes 4 x 4,096 = 16,384 instructions, plus 3 x 8 = 24 for the outer loop. Its two loads per node came to about five sixths of all the loads in the whole program in one test. The innermost loop is almost always where a program spends its time, which is why the compiler, the architect and the performance engineer all look there first.
Calls and Returns
A function call is a jump that remembers where to come back to. On RISC-V the call writes the address of the instruction after it, the return address, into register ra, and jumps to the function. The function ends with ret, short for jalr x0, 0(ra): jump to the address in ra. In the listings here every call is the two-instruction sequence auipc and jalr, because the programs are linked without relaxation; Assembling, Linking and Loading explains why. Here is the start-up code calling main:
   0:  lui   sp,0x10         # sp = 0x10000, the top of the 64 KB memory
   4:  auipc ra,0x0          # ra = 0x4
   8:  jalr  20(ra)          # jump to 0x4 + 20 = 0x18 (main), ra = 0xc
   c:  lui   t0,0xf0000      # main has returned: its result is in a0
  10:  sw    a0,0(t0)        # write it to the end-of-program port
Because the return address is in a register, one copy of a function can be called from anywhere and always returns to its caller. Arguments travel in registers too, the first in a0, and the result comes back in a0; the rules for that are the subject of The Calling Convention and ABI.
Why Nested Calls Need Memory
There is only one ra. When main calls __umodsi3 (the library routine for the % operator, which RV32I has no instruction for), that call overwrites ra with an address inside main. The address main needs in order to return to the start-up code is lost, unless main saved it before. A function that calls nothing, a leaf function, never has this problem. The main of the array program is a leaf: it keeps everything in registers, ends with ret, and never touches memory outside its array. The main of the linked-list program is not a leaf, so it must save ra somewhere that the call cannot overwrite.
The same applies to every register whose value is still needed after a call, because the called function may use those registers too. The number of calls in progress at one moment is the call depth. In the linked-list program the deepest point is three calls below the start-up code: main, then __umodsi3, which itself calls __udivsi3. Each level needs somewhere to keep its return address and its live values while the levels below it run, and that place is the stack.
Quick Check
Q: __umodsi3 calls __udivsi3 with jal, which overwrites ra, yet the listing shows no store to memory: it starts with mv t0,ra and ends with jr t0. How can that work?
Show Answer
It saves the return address in another register instead of in memory. That is safe only because the library authors know that __udivsi3 never changes t0. Ordinary compiled functions cannot make such assumptions about arbitrary callees, so they save ra on the stack; the hand-written library routines use the shortcut because they are called so often.
The Stack
The stack is a region of memory used in last-in, first-out order, like a stack of plates: the most recent call puts its data on top and removes it when it returns, uncovering the data of its caller. Register sp, the stack pointer, holds the address of the top. In the programs here, the start-up code sets sp to 0x1_0000, the address just above a 64 KB memory, and the stack grows downwards from there: a function makes room by subtracting from sp and gives it back by adding the same amount. Code and global data sit at the bottom of memory and the stack starts at the top, so the two grow towards each other and the free space between them is shared.
The block of stack one call uses is its stack frame. It is created by the first instructions of the function, the prologue, and removed by the last ones, the epilogue. This is the real prologue of main in the linked-list program and the frame it builds:
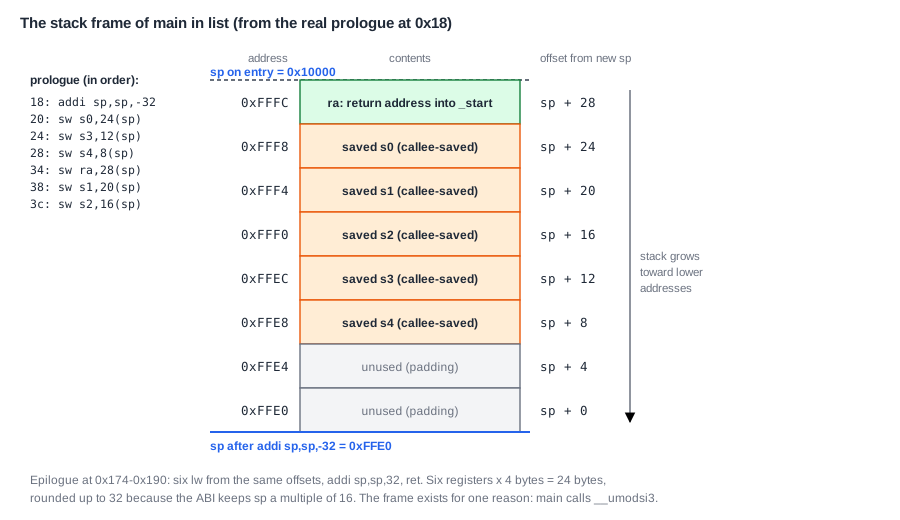
addi sp,sp,-32 reserves 32 bytes, moving sp from 0x1_0000 to 0xFFE0. Then six stores fill the frame: ra at sp+28, and the saved registers s0 to s4 at sp+24 down to sp+8. The compiler mixes these stores with other instructions to keep the pipeline busy, which is why they are not in a row. main needs five s registers because they hold values that must survive the 511 calls to __umodsi3, such as the loop pointer and the random seed, and the convention says a function that uses an s register must restore its old value before returning. Six registers take 24 bytes; the frame is 32 because the RISC-V convention keeps sp a multiple of 16 bytes, so 8 bytes at the bottom stay unused. The epilogue at 0x174 loads the six registers back from the same offsets, executes addi sp,sp,32 and returns.
Every slot is addressed relative to sp, never with a fixed address. That is what makes the stack work: the same function called at a different depth simply gets a frame at a different place. A frame can hold four kinds of things: the return address, saved registers, local variables that do not fit in registers (or whose address is taken, like a random seed when its generator is not inlined), and arguments beyond the eighth for functions it calls. Unoptimized code also keeps a frame pointer in s0, a second register pointing to the top of the frame, so that a debugger can find every local variable at a fixed offset from it.
How deep does the stack go? One way to find out is to watch every write to register x2 (sp) during a run and record the lowest value. In one test the results matched the prologues: the array program never moved sp at all, the linked-list program went 32 bytes deep, and a matrix program 48 bytes, because its main builds a 48-byte frame before calling __mulsi3, which is a leaf and needs none.
Where Does This Matter?
On a microcontroller the stack is a fixed slice of a small SRAM, often a few kilobytes, and nothing stops it from growing into the global variables below it: the program just corrupts its own data and fails much later. Firmware teams therefore compute the worst-case stack depth of every task with tools that read the call graph and each function's frame size, and add a guard region or a hardware stack limit check. Safety standards for automotive and avionics code forbid or restrict recursion for exactly this reason: its depth depends on the data. And security attacks such as buffer overflows work by overwriting a saved ra in a stack frame so that ret jumps to the attacker's code.
Recursion
A recursive function calls itself. Each call that has not yet returned has its own frame, so the stack depth equals the deepest chain of unfinished calls times the frame size. Two small recursive programs show what happens. The first is the classic Fibonacci function:
static u32 fib(u32 n)
{
    if (n < 2)
        return n;
    return fib(n - 1) + fib(n - 2);
}
u32 main(void) { return fib(15); }
Both builds return the correct fib(15) = 610 (0x262). Written this way, each call with n of 2 or more makes two more calls, so the calls form a tree. At -O0 the program executes exactly that tree, nearly 2,000 calls of fib. At -O2 GCC did something cleverer: it turned the second recursive call into a loop. The compiled fib calls itself for n - 1, then n - 3, n - 5 and so on, adding up the results, and only the first branch of each step is a real call:
  48:  addi  a0,s0,-1        # argument: s0 - 1
  4c:  auipc ra,0x0
  50:  jalr  -52(ra)         # call fib(s0 - 1)
  54:  addi  s0,s0,-2        # s0 = s0 - 2
  58:  add   s2,s2,a0        # add the result to the running total
  5c:  bltu  s3,s0,48        # repeat while s0 > 1
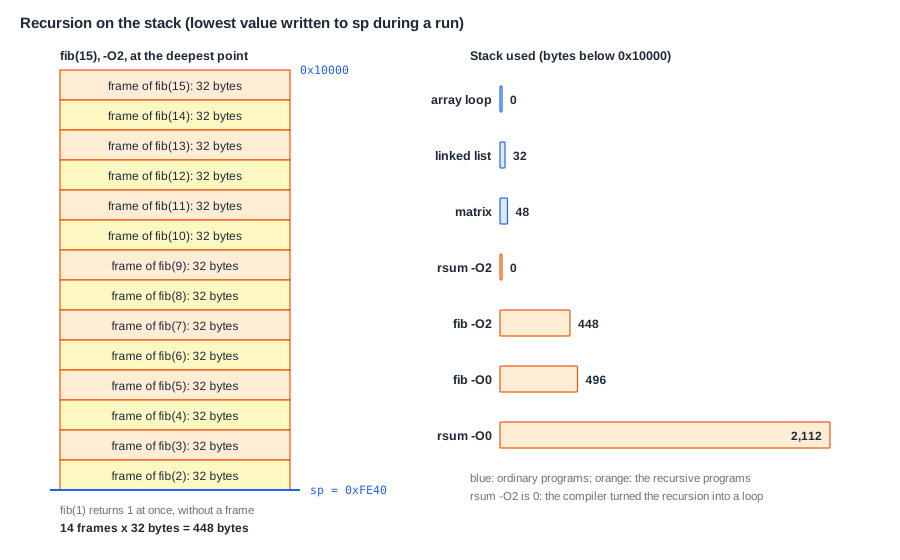
That halves the number of calls and cuts the instruction count by more than half, but the deepest chain is still fib(15), fib(14) and so on down to fib(2): 14 frames of 32 bytes each. fib(1) returns 1 at once, before building a frame, because the compiled code tests for it first. The prediction is 14 x 32 = 448 bytes, and a real run gives exactly that: the lowest sp is 0xFE40, 448 bytes below 0x1_0000.
There is one more trick in the -O2 build. main does nothing after fib returns except return the same value, so GCC ends main with a plain jump to fib (jr through t1) instead of a call. This is a tail call: main needs no frame and no saved ra, and fib returns straight to the start-up code.
When Recursion Disappears
The second program, rsum, adds up a 64-element array recursively: the sum of n elements starting at p is p[0] + rsum(p + 1, n - 1), and the sum of 0 elements is 0. Each call does one addition after the call it makes returns, so the depth is the array length plus one. The two builds behave very differently: at -O2 the program used no stack at all, while at -O0 it used more than 2 KB of stack and ran about five times as many instructions.
At -O2 the compiler recognized that the pending additions can be done as a running total, which turned the recursion into an ordinary loop of 4 instructions per element: no calls, no frames, and the program never moves sp. At -O0 the recursion runs as written: 65 nested calls of rsum (n = 64 down to 0), each with a 32-byte frame, below the 32-byte frame of main. The prediction 32 + 65 x 32 = 2,112 bytes matches a real run exactly. Each frame holds ra, the frame pointer s0, s1, which keeps p[0] across the call, and the two arguments, which -O0 stores to the stack.
A 64 KB memory could hold at most 65,536 / 32 = 2,048 such frames even if nothing else were in memory, so rsum at -O0 would crash, silently, for an array of a few thousand elements. The same array at -O2 works for any length. Code that depends on such an optimization is fragile: a debug build, a different compiler or a small change to the function can bring the recursion back.
Quick Check
Q: At -O0, fib has a 32-byte frame, main a 16-byte frame, and every call builds its frame first, including fib(1) and fib(0). How deep does the stack go for fib(15)?
Show Answer
The deepest chain is main, fib(15), fib(14), ..., fib(1): 15 frames of fib, because without the optimization fib(1) also builds a frame. 16 + 15 x 32 = 16 + 480 = 496 bytes. The unoptimized build is 48 bytes deeper than the -O2 build: one more frame of 32 bytes for fib(1), and 16 for main, which no longer makes a tail call.
Predicting the Instruction Count
The method used for the array loop works for any program, including recursive ones: split the code into blocks that always run together, count the instructions of each block, multiply by the number of times the block runs, and add. For recursion, count the calls first. Take rsum at -O0. Its listing splits into three paths through the function:
rsum, from entry to the test of n (0x18 to 0x38):              9 instructions, every call
  n > 0: prepare the arguments and call (0x44 to 0x68):       10 instructions
         after the call returns: add and epilogue (0x6c to 0x88): 8 instructions
  n = 0: return 0 (0x3c, 0x40) and epilogue (0x74 to 0x88):    8 instructions
Of the 65 calls, 64 have n greater than 0 and cost 9 + 10 + 8 = 27 instructions each, and one has n = 0 and costs 9 + 8 = 17. That gives 64 x 27 + 17 = 1,745 instructions inside rsum. The practice exercise below completes the count for main. Once a prediction like this matches a real run, you can trust your understanding of the listing, and a mismatch tells you that a loop runs a different number of times than you thought.
Common Mistakes
Mistake #1: Counting the instructions in the listing instead of the executed ones
The array program has 22 instructions in its file and executes over 8,000. Run time follows the dynamic count, which comes from the loop and call counts, never from the size of the code.
Mistake #2: Sizing the stack from the optimized build alone
rsum needs no stack at -O2 and more than 2 KB at -O0. Debug builds, other compilers and code changes can make a function recursive again or its frames larger. Size the stack for the worst build that will ever run, and measure it by recording the lowest sp.
Mistake #3: Assuming every call costs a frame
Leaf functions such as the array program's main and __mulsi3 use no stack, tail calls reuse the caller's frame, and inlined functions are not calls at all. Read the prologue in the listing to know a function's frame size, rather than guessing it from the C code.
Practice Exercise
Challenge: Predict rsum at -O0, Then Check
Complete the instruction count of rsum built at -O0. Inside rsum, the 65 calls cost 1,745 instructions (see above). Its main has these blocks: a 6-instruction prologue that ends with a jump to the loop test; a loop body of 11 instructions that runs 64 times, once per element; a loop test of 3 instructions; a 5-instruction block that prepares the arguments and calls rsum; and a 6-instruction block that returns. The start-up code contributes 4 instructions. Predict the total. Then predict the stack depth from the frame sizes (32 bytes for main and for each call of rsum).
Hint
The loop jumps to its test first, so the test runs once more than the body: 65 times.
Solution
main: 6 + 11 x 64 + 3 x 65 + 5 + 6 = 6 + 704 + 195 + 11 = 916 instructions. Total: 916 + 1,745 + 4 = 2,665, which is what a real run gives. Stack: at the deepest point the frames of main and of all 65 calls of rsum are on the stack at once, 32 + 65 x 32 = 2,112 bytes, so the lowest sp is 0x1_0000 - 2,112 = 0xF7C0.
Summary
- The processor only follows the PC; loops turn a static count of 22 instructions into a dynamic count of 2 x 4 x 1,024 + 12 = 8,204.
- A call saves the return address in
ra; a function that calls another must saveraand the registers it still needs, usually on the stack. - The stack grows down from 0x1_0000; a 32-byte frame can hold
raands0-s4plus 8 bytes of padding that keepspa multiple of 16. - Recursion uses one frame per unfinished call: fib(15) at
-O2needs 14 x 32 = 448 bytes,rsumat-O02,112 bytes, and both predictions match real runs. - Compilers can remove calls (inlining, tail calls) and even recursion (
rsumat-O2uses no stack), so stack sizes and counts must be read from the real listing and checked by measurement.
