
How big should a cache be, how long its lines, how many ways? There is no formula, because the answers depend on what the program does. The honest way to decide is a sizing study: run real address traces through cache models across a range of settings, and look at the curves. This article runs such a study on six small programs. It shows the working-set knee, an accident caused by array placement, the turning point in line size, and how to turn it all into a decision that includes area and hit time.
11 min read | Intermediate
What You'll Learn
- Read a miss-rate curve and find a program's working set
- Explain why line size has a best value
- Explain how associativity interacts with size
- Choose a cache configuration using AMAT and area
How the Study Works
A cache model needs only the sequence of addresses a program uses. A trace was recorded by running six small compiled RV32I programs in a simple simulator, whose instruction and memory counts matched a real five-stage design exactly. The instruction fetch and data addresses were then fed through a software model of a cache, for each combination of size, line length and associativity. That takes a few seconds per configuration, against hours for a detailed simulation of a full processor. Cache Organization explains the terms.
These programs are small, so the absolute sizes here are small too. Real software needs caches a thousand times larger. But the shapes of the curves are the same at any scale, and that is what a study teaches.
Size: Finding the Working Set
A program's working set is the data it is actively using in a period of time. When the cache is smaller than the working set, it keeps evicting data that will soon be needed. When it is larger, misses fall to nearly nothing but the first touches. Plotting the miss rate against size shows this as a knee:
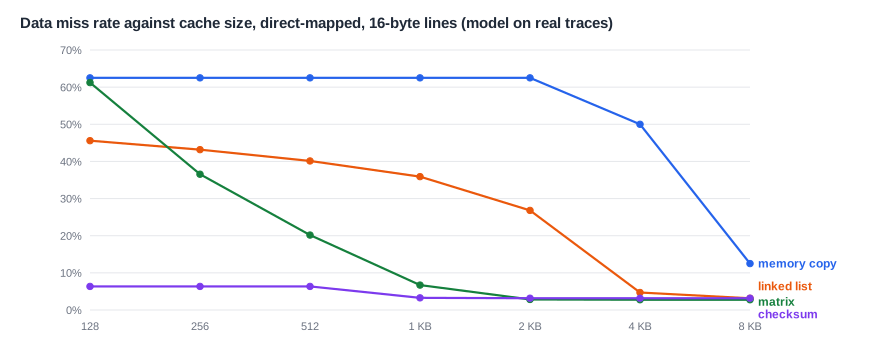
The linked list has a clear knee. Up to 2 KB its miss rate stays high, and at 4 KB it drops to about 5 percent. Its nodes take 4 KB, and once they all fit, the walk through the list hits every time. Below that point, more cache brought little gain: a size just under the knee is nearly useless. That is typical of programs that loop over a data set larger than the cache.
The matrix program falls steadily, because it has several overlapping working sets, from the rows it is using now to the whole matrix. The checksum is almost flat, because it uses a small table and otherwise barely touches memory: once the table fits, it stays at about 3 percent, and all of those are compulsory misses.
The memory copy is the odd one. It stays at 62.5 percent all the way to 2 KB, and only then falls. Each pass reads a 4 KB array and writes a 4 KB array, so a cache needs about 8 KB to hold both. Its miss rate never goes below 12.5 percent, because every line must be fetched once, and each line's four words are used only twice in the whole run: one miss for every eight accesses.
Instructions Are Easier
The same study for instruction fetches gives a very different result. These programs have tiny loops, so even a 256-byte instruction cache missed less than 1 fetch in 1,000 on five of the six. The linked-list program was the worst, at about 1 in 50, and with 512 bytes it too came to almost nothing. Real software has far more code, but instruction streams have strong locality in general.
Quick Check
Q: A program's miss-rate curve is flat from 16 KB to 256 KB, then drops sharply at 512 KB. What does that say, and what would adding cache to reach 128 KB gain?
Show Answer
Its working set is between 256 and 512 KB. Going to 128 KB would gain nearly nothing, because the program would still not fit. For this program, a cache is either large enough or close to useless.
Associativity: Curing Accidents
Here are the data miss rates for a 1 KB cache as the number of ways grows:
| Program | Direct-mapped | 2-way | 4-way |
|---|---|---|---|
| memory copy | 62.5% | 25.0% | 25.0% |
| matrix multiplication | 6.7% | 5.7% | 5.0% |
| checksum | 3.3% | 3.3% | 3.4% |
| linked list | 35.9% | 36.4% | 36.6% |
The memory copy gains a lot, going from 62.5 to 25 percent at 2 ways. Its problem was an accident of placement: the source and destination arrays mapped to the same lines, which is a conflict problem. 4 ways then add nothing more. The matrix program gains a little more at each step. The checksum and the linked list get nothing, and they even get slightly worse, because their misses are of the compulsory and capacity kinds. A cache of this size just cannot hold the list, however it arranges it. Miss Types and Average Memory Access Time explains the three kinds.
That is a general lesson. Associativity protects a design against bad luck in where data happens to fall. It is a form of insurance as much as a performance feature, which is why few real caches are direct-mapped, even when the average gain looks small. The cost of that insurance is extra delay and power.
Line Size: A Best Value
A longer line brings in more neighbors per miss, which helps spatial locality, but it fills the cache with fewer different blocks. In a 1 KB, 2-way cache:
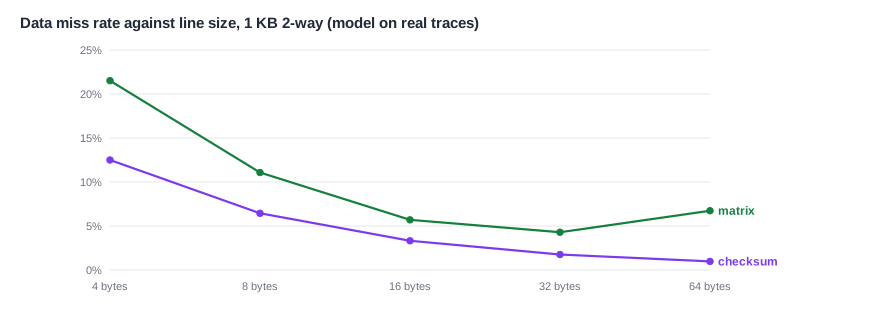
For the checksum, longer lines keep helping all the way, because it reads a table and a buffer in order. Each doubling cuts the miss rate roughly in half. The matrix program has a turning point. Its miss rate falls up to 32 bytes, and then it rises at 64, because with so few lines in a 1 KB cache, each new line pushes out data that was still useful. A cache with more room would move this point to a longer line.
The miss rate is not the whole story. A longer line also takes longer to fetch, because more bytes have to come over the same bus. If a bus delivers 4 bytes per cycle, a 64-byte line takes 16 cycles after the first access, compared with 4 cycles for a 16-byte line. So the miss penalty rises with line size, and the best line for AMAT is shorter than the best for miss rate. Real designs settled long ago on 64 bytes for most large processors, which suits DRAM, whose burst transfers deliver about that much at once.
Turning Curves into a Decision
A worked decision shows how the pieces come together. Suppose a small core has room for up to 8 KB of data cache, a 20-cycle miss penalty and these assumed numbers for a typical workload:
| Option | Hit time | Miss rate | AMAT | Added area |
|---|---|---|---|---|
| 2 KB, 2-way | 1 cycle | 8% | 2.6 cycles | 2% |
| 4 KB, 2-way | 1 cycle | 5% | 2.0 cycles | 4% |
| 8 KB, 4-way | 2 cycles | 3% | 2.6 cycles | 9% |
The largest cache has the lowest miss rate, but its extra cycle on every hit makes it no better than the smallest, at more than four times the area. The middle option wins. A team would still check it on more workloads, and check that the 1-cycle access really fits in the clock period, which is often what decides the size of a first-level cache. PPA Trade-offs and Amdahl's Law gives the general method.
Where Does This Matter?
Cache sizing happens early in a chip's life, and it is hard to change later, since memories fill much of the floorplan. Teams run long traces of target workloads through fast models, then confirm the short list with detailed simulation. For embedded products, the question is often whether a cache is needed at all: if code runs from fast on-chip memory, a cache adds area and timing uncertainty for no gain. If it runs from slow flash, even a 1 KB instruction cache can double the speed.
One Cache or Two?
The study above treated instructions and data separately, but a designer with a fixed budget may ask how to split it. Given these programs, the answer is obvious: code hardly needs any cache, so nearly all the space should go to data. On a larger program the balance moves back. Instruction misses are especially painful on a large core, because they stop the whole front end, and nothing else in the pipeline can hide them. Server software, with its huge amount of code, often suffers more from instruction misses than a small benchmark ever would.
The study also assumed a fixed memory penalty. If the penalty grows, the best cache grows with it, because each avoided miss is worth more. A microcontroller with a 2-cycle flash has little need for a cache, while the same core with a 20-cycle flash has every reason to have one. The trace stays the same in both cases, and only the arithmetic after it changes. That is another advantage of keeping the trace model separate from the timing model.
What This Study Leaves Out
A model like this leaves out plenty. It has no operating system, no other programs sharing the cache, no wrong-path accesses from speculation, and no prefetcher. And the data in these small programs is tiny. A large program's curve may have several knees, one for each kind of data it touches. In a chip with several cores, the shared cache's curve depends on what the others are doing.
A trace-driven model also assumes that the order of accesses does not depend on the cache. That is true for a simple pipeline. In an out-of-order core it is not quite true, because the timing changes which instructions run when.
Quick Check
Q: Two caches have the same size. One has 32-byte lines and misses 4 percent of the time, with a 30-cycle penalty. The other has 64-byte lines and misses 3 percent of the time, with a 36-cycle penalty. Both have a 1-cycle hit time. Which has the better AMAT?
Show Answer
32-byte: 1 + 0.04 x 30 = 2.2 cycles. 64-byte: 1 + 0.03 x 36 = 2.08 cycles. The longer line is slightly better here, although its penalty is larger.
A good study therefore states its limits as clearly as its results.
Common Mistakes
Mistake #1: Studying data sets that fit
If the benchmark's data fits in the cache, all sizes above that look equally good, and the study says nothing. Use data as large as the real product's, or scale the cache and the data together.
Mistake #2: Looking at the miss rate only
The miss rate ignores the hit time, the fetch time of a longer line, and area. Compare with AMAT, or with cycles from a full model.
Mistake #3: Averaging over programs
An average can hide one program with a terrible result, such as a thrashing case. Look at each program's curve, and pay attention to the worst case that matters.
Practice Exercise
Challenge: Pick a Line Size
A cache has a 1-cycle hit time. Memory takes 20 cycles for the first 8 bytes and 1 more cycle for each further 8 bytes. These numbers are assumptions for this exercise. Measured miss rates are: 16-byte lines, 6 percent; 32-byte lines, 4 percent; 64-byte lines, 3.5 percent; 128-byte lines, 3.4 percent. (a) What is the miss penalty for each line size? (b) What is the AMAT for each? (c) Which is best?
Hint
A 16-byte line needs 2 transfers of 8 bytes: 20 + 1 = 21 cycles.
Solution
(a) 21, 23, 27 and 35 cycles. (b) 1 + 0.06 x 21 = 2.26. 1 + 0.04 x 23 = 1.92. 1 + 0.035 x 27 = 1.945. 1 + 0.034 x 35 = 2.19. (c) 32-byte lines, narrowly ahead of 64, while the miss rate alone would have chosen 128.
Summary
- A miss-rate curve shows a program's working set as a knee; below the knee, more cache gains little.
- Associativity cures conflict accidents: 2 ways took one memory copy from 62.5 to 25 percent, while others gained nothing.
- Longer lines help until they crowd out useful data, and they take longer to fetch.
- Real decisions use AMAT, area and whether the hit fits in the clock period.
- Small kernels show the shape of the curves, but final sizes need large, realistic workloads.
