
A block-level failure usually points close to its own cause - a scoreboard mismatch inside a testbench that only exercises one interface leaves a short list of places to look. An SoC-level failure rarely works that way: the symptom can surface many cycles and several blocks away from whatever actually went wrong, and a nightly regression can hand back dozens of failing tests before anyone has looked at a single one. This article covers how debug has to change once the DUT is an entire chip.
9 min read | Intermediate Level
What You'll Learn
- Why raw waveform debugging stops scaling once a failure spans multiple blocks and interfaces
- How transaction-level debug lets an engineer trace a failure back toward its actual origin
- Why a large regression's failures need automated triage before anyone debugs them individually
- What separates a good failure signature from just matching on error message text
- Why reproducibility has to come before debug, and what that means for multi-core races specifically
- What role automated, causal-graph-based root-cause tools actually play alongside an engineer
Why SoC-Level Debug Is a Different Problem
Decoding raw signal waveforms works well when the distance between cause and symptom is short - a handful of cycles, one or two modules. At the SoC level that distance stretches out considerably: a request issued by one master can pass through an interconnect, get reordered against unrelated traffic, cross a clock domain, and only produce a visible failure several blocks and many cycles later, in a component that had nothing to do with the actual mistake. Stepping through that entire path signal by signal in a waveform viewer is possible in principle, but it doesn't scale to how often it has to happen across a real regression.
Transaction-Level Debug as the Starting Point
The practical answer is to debug at the same level the testbench already thinks in - transactions, not raw signals. A UVM environment's monitors already reconstruct the traffic on every interface as transaction objects; recording those transactions, along with the relationships between them, gives an engineer a much shorter path from symptom to cause than a waveform ever could.
The relationship that matters most is predecessor/successor: a completion transaction on one interface can be traced back to the specific request transaction on a different interface that caused it, even when the two are separated by an interconnect, an arbitration delay, or a clock domain crossing in between. Instead of manually correlating timestamps across several waveform windows, an engineer starts at the transaction that looks wrong and walks backward through this chain until something in it doesn't match expectations - at which point, and only then, dropping down to the raw signals around that one specific transaction is worth the time.
// Transaction recording captures the predecessor link, not just the
// transaction's own fields - this is what makes backward tracing possible
class axi_txn extends uvm_sequence_item;
  `uvm_object_utils(axi_txn)

  rand bit [31:0] addr;
  rand bit [31:0] data;
       txn_id_t   txn_id;
       txn_id_t   caused_by;   // predecessor transaction, set by the monitor
                                // that observed the causal request upstream

  // Rest of the code: standard fields, constraints, do_compare, etc.
endclass
This is the same passive-monitor infrastructure already used for reusing block-level UVCs at the SoC level - the transaction recording a monitor does for reuse and checking is the same recording that makes transaction-level debug possible, not a separate piece of infrastructure built just for debug.
Reproducibility Comes Before Debug
None of transaction-level tracing helps if the failure can't be made to happen again on demand. A constrained-random test is, by construction, deterministic given the same random seed, the same RTL, and the same tool version - rerunning with that seed reproduces the identical sequence of stimulus, which is what makes it possible to sit down and actually debug the failure rather than chase a moving target.
Multi-core and concurrent scenarios complicate this. A race between cores can depend on the real scheduling of parallel simulation processes or emulation hardware, not just on the random seed that generated the stimulus - two runs with the identical seed can still land on different interleavings if the underlying execution schedule isn't itself captured and replayed. Debugging this class of failure reliably means logging the actual interleaving that occurred, not just the seed that produced the stimulus feeding into it, and replaying that specific schedule rather than hoping the same seed reproduces the same race.
Where Automated Root-Cause Tools Fit
Transaction tracing and failure triage both still leave the actual root-cause reasoning to the engineer. A newer category of debug tooling automates a first pass at that reasoning directly: taking a failure's trace data - waveforms, a counter-example from a formal run, or the assertions and specification that were violated - and building a causal graph connecting the signals and events involved, mirroring the same backward-tracing an engineer already does mentally. The tool then explores that graph to generate ranked hypotheses about the likely root cause, each with supporting evidence from the trace, rather than a single unexplained answer.
The realistic role for this kind of tool is augmenting the first pass of triage, not replacing the engineer's judgment - it narrows a large trace down to a short list of plausible causes with evidence attached, which is exactly the part of debug that scales worst as failures pile up in a large regression. The engineer still confirms which hypothesis is actually correct and decides on the fix.
Failure Triage at Regression Scale
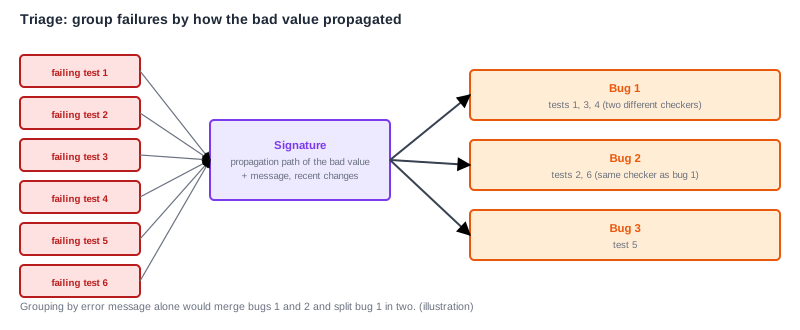
A single failure is a debug problem. Forty failures from one overnight regression is a triage problem, and treating each one as its own investigation wastes most of the effort on failures that turn out to share the same root cause. The practical first step isn't debugging any individual failure - it's grouping all of them by which ones are actually the same bug, so a team debugs a handful of distinct root causes instead of forty individual symptoms.
Grouping by error message text alone is a weak signal: the same underlying bug can trip completely different checkers depending on which test happened to exercise it, making related failures look unrelated, while genuinely different bugs can trip the identical checker with the identical message, making unrelated failures look like duplicates. A more reliable signature is built from how the failure actually propagated through the design - which signals or transactions carried the bad value, and from where - rather than just where it was finally caught. Grouping on that propagation path, with the error message and recent code changes as secondary tie-breakers, is what correctly separates two distinct bugs that happen to trip the same checker and correctly merges one bug that happens to trip several different checkers depending on the test.
Common Mistakes
Debugging every regression failure individually from raw waveforms before triaging.
Without grouping first, a team can spend a full day independently debugging what turns out to be the same root cause five separate times. Triage first, then debug one representative failure per group.
Bucketing failures by error message text alone.
The same bug can produce different error messages depending on which checker happens to catch it, and different bugs can produce the same message. A signature built from the actual failure propagation path is far more reliable than message text.
Chasing the symptom furthest downstream instead of tracing back toward the actual origin.
The component that finally reports the failure is often several transactions removed from where the mistake actually happened. Use the predecessor chain to walk backward before assuming the reporting component is where the bug lives.
Summary
In this article, you learned:
- SoC-level failures often surface far from their actual cause, which makes raw signal-by-signal waveform debugging impractical at this scale
- Transaction-level debug lets an engineer trace a failure backward through predecessor/successor relationships, only dropping to raw signals once the search has narrowed to a specific point
- The same monitor infrastructure used to reuse block-level UVCs at the SoC level is what makes transaction-level debug possible in the first place
- A large regression's failures need automated triage - grouping by root cause - before individual debugging starts, or the same bug gets independently debugged many times over
- A failure signature built from how a bug actually propagated through the design is a far more reliable grouping signal than matching on error message text alone
- A failure has to be reproducible before it can be debugged at all - and for multi-core races, that means capturing the actual execution schedule, not just the random seed
- Causal-graph-based root-cause tools can narrow a large trace down to a short list of evidence-backed hypotheses, but confirming the actual cause and deciding the fix still falls to the engineer
